Ernest J. Feleppa - feleppa@Biomed1.rrinyc.org
Biomedical Engineering Laboratories
Riverside Research Institute
New York, NY 10036
Popular version of paper 2pEA5
Presented Tuesday afternoon, 3 December 1996.
3rd Joint ASA/ASJ Meeting, Honolulu, HI
Embargoed until 3 December 1996
Projections estimate that approximately one million prostate biopsies will be performed in 1996 and more than 300,000 cancers will be detected in the U.S. Urologists use conventional ultrasound images to guide prostate biopsies to detect and diagnosis prostate cancer. However, conventional images cannot adequately distinguish suspicious prostatic tissue from normal or other non-cancerous tissue; therefore, it cannot be used effectively to guide the needle. Approximately a third of men who are biopsied a second time within six months of an initial negative biopsy prove to have prostate cancer. Because prostate cancer is unlikely to have developed in that six-month interval, we infer that nearly half the cancers are missed at the initial biopsy. Furthermore, more than half of the initially biopsied prostate glands in fact do not contain cancer. Therefore, approximately half of the biopsies that are performed are, in hindsight, unnecessary. Since biopsies add to the cost of a prostate examination and consultation by over $1,000, the national cost for biopsies will be in the range of a billion dollars in 1996. A method that can improve the assessment of suspicion for the presence of cancer, and particularly that can improve guidance of the tissue-sampling biopsy needle, can have a major beneficial impact on the management of prostate cancer by improving detection and reducing unnecessary biopsies.
Surgery can cure prostate cancer if the disease is confined to the gland when surgery is performed. Unfortunately, pathological examinations show that approximately 30% of surgical specimens have cancer outside the gland. Conventional imaging methods cannot reliably determine whether cancer has spread, and therefore, whether surgery is appropriate. As a consequence, many prostatectomies are inappropriately performed. A method that enables better assessment of the spread of prostate cancer outside the gland can benefit the treatment of prostate cancer by eliminating unnecessary surgery and by initiating appropriate therapy without delay.
We have developed method of analyzing ultrasonic echo signals that may satisfy both areas of need: it may provide better biopsy guidance and better assessment of the risk of cancer outside the prostate. This method is called ultrasonic spectrum analysis. We first applied it to the typing of ophthalmic tumors in the 1970s, and it has proven to be effective not only for distinguishing primary from metastatic cancers in the eye, but also for differentiating among primary eye tumors that have different degrees of potential for causing death. Our recent studies have applied these methods to characterization of prostate tissue, and we have obtained very encouraging results indicating that spectrum analysis can detect tissue properties associated with prostate cancer. The sensitivity of spectrum analysis to the unique properties of cancerous prostate tissue appears to offer a means of better biopsy guidance and improved assessment of cancer spread.
While conventional ultrasonic images show the strength (or "loudness") of echoes received from each portion of the image plane, spectrum analysis shows how the tissue changes ultrasound that passes through and is echoed by the tissue. The echo mechanism in the prostate is termed scattering, and the effects of tissue on scattered ultrasound depend on the size, concentration, and mechanical properties of the microscopic tissue structures that cause the scattering. These effects can arise from small aggregates of cells, collagen fibers, nests of capillaries, or glandular spaces (acini) in the prostate. The ultrasound frequencies used in prostate examinations cover a range of ultrasound frequencies extending from 3 to 8 MHz (million cycles per second); this frequency band is sensitive to scatterer sizes in the range of a few tens to a few hundreds of a micron. (A micron is a thousandth of a millimeter.) This size range is consistent with the glandular structures that are obvious candidates as the main scatterers in the prostate.
Spectrum analysis of the echoes of ultrasound pulses transmitted into the prostate gland during a standard ultrasound examination shows the relative strength of scattered echo signals across the range of ultrasound frequency that is used. The features of the spectrum of the echo signal are theoretically related to the scattering properties of the tissue. We are in the process of testing the hypothesis that the spectral differences we observe are associated with differences in the composition and concentration of the glandular elements present in normal and cancerous prostate tissue.
Data for this research program are obtained by acquiring "raw" ultrasound echo signals (not images made from the echoes) during the standard ultrasound examination used to guide biopsies. We analyze echo signals originating from the same tissue that is sampled by the biopsy, and compare spectrum-analysis from the sampled tissue to the type of tissue found in the matching biopsy. We then enter the tissue type, the spectral features, other clinical data, and the urologist's assessment of the likelihood that the biopsy is cancerous into a data base. The urologist's assessment is based on the conventional ultrasonic image used to guide the biopsy.
We use a technique termed ROC analysis to compare the efficacy of spectrum analysis and conventional imaging. Using this method, a score of 100 indicates a "perfect" means of classifying an unknown tissue; a score of 50 indicates that classification is purely random -- no better than rolling dice or flipping coins. Our results to date show that ultrasound spectrum analysis produces a score of 79 in distinguishing cancerous from non-cancerous prostate tissue; conventional ultrasound produces a score of 60, which is consistent with its known ineffectiveness.
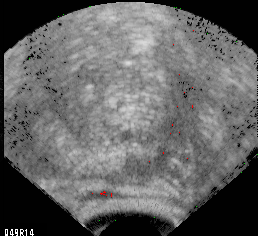
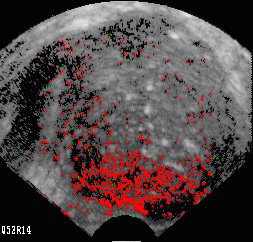
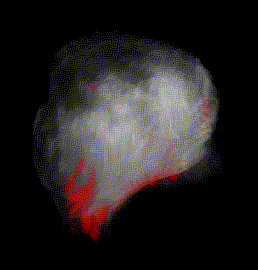
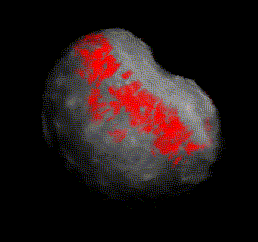
We use a technique termed "staining" to generate images, equivalent in appearance to conventional ultrasound images, that are colored red where a local (less than half a millimeter) portion of tissue displays spectral features consistent with cancer. We inspect our data base to determine the range of different spectral features associated with biopsy-proven cancerous prostate tissue. We then compare local values of parameters within a scan and color encode images where local spectral parameter values fall within the value range of cancer. We blindly applied staining to several cases, and consistently produced images such as those of Figures 1A and 1B that show single planes through a cancer-containing and a cancer-free gland; both images show red pixels superimposed on a special image generated from a "stable" spectral parameter -- the value of the spectrum in the center of the usable frequency band. Figures 2A and 2B show three-dimensional representations of a different cancer-containing gland, and clearly indicates the presence of cancer in the base of gland where the biopsy detected cancer. Both volume renderings of Fig. 2 place red encoding for cancer on the standard grey scale image.
 Fig. 1A Non-cancerous prostate gland with spurious red pixels in the rectal wall (bottom) and hypoechoic lateral region (right).
Biopsy of this scan plane would not be warranted
 Fig. 1B Cancerous prostate gland with an extensive region of red pixels in glandular peripheral zone (bottom) where cancer was
found by biopsy. Biopsy of this scan plane clearly would be warranted and spread would be suspected
 Fig. 2A 3-D volume of a cancerous prostate gland with red, cancer-indicating pixels partially visible through the semi-transparent volume. The cancer-free apex of the gland is up; the cancer-containing base is down; the rectum is to the lower right.
 Fig. 2B 3-D volume of a cancerous prostate gland with red, cancer-indicating pixels visible near the surface of the semi-transparent volume. The cancer-containing base of the gland is up; the cancer-free apex is down (hidden); the rectum is to the
upper right.
References
E.J. Feleppa, T. Liu, A. Kalisz, M.C. Shao, W.R. Fair, N. Fleshner, and V. Reuter, "Ultrasonic spectral-parameter images of the prostate," International Journal of Imaging Systems and Technology, (in press).
E.J. Feleppa, W.R. Fair, A. Kalisz, J.B. Sokil-Melgar, F.L. Lizzi, A. Rosado, M.C. Shao, T. Liu, Y. Wang, M. Cookson, and V. Reuter, "Typing of prostate tissue by ultrasonic spectrum analysis," IEEE Transactions on Ultrasonics, Ferroelectrics, and Frequency Control, 43:609-619, 1996.
E.J. Feleppa, W.R. Fair, T. Liu, N. Fleshner, A. Kalisz, V. Reuter, and M.C. Shao, "3-D tissue typing of prostate tissue based on spectral parameters," in Proceedings of the 1995 Ultrasonics Symposium, pp. 1171-175, M. Levy, S. Schneider, and B. McAvoy, editors, Institute of Electrical and Electronics Engineers, Piscataway, NJ, 1996.
E.J. Feleppa and F.L. Lizzi, "Ophthalmological tissue characterization by scattering," in Ultrasonic Scattering in Biological Tissues, pp. 393-408, K. Shung and G. Theime, editors, CRC Press, Boca Raton, FL, 1993.