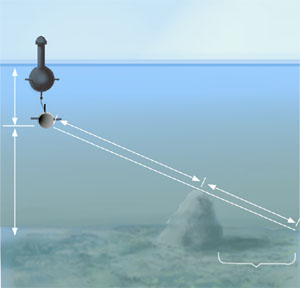
Figure 1. A remotely-piloted vehicle towing a side scan sonar.
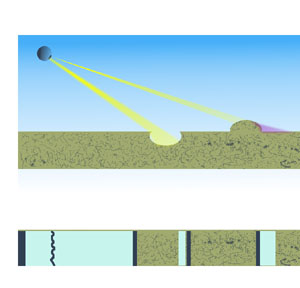
Figure 2. Example side scan sonar image.
John Impagliazzo- impagliazzo@tech.npt.nuwc.navy.mil
Walter Greene-greenewe@tech.npt.nuwc.navy.mil
Naval Undersea Warfare Center
Code 8212
Newport, RI
Contact Information During ASA Meeting:
Clarion Hotel
700 Monticello Ave.
Norfolk, VA 23510
Popular version of paper 2aSP1
Presented Tuesday morning, October 13, 1998
136th ASA Meeting, Norfolk, VA
The Gulf War was a reminder of the importance of having the capability to deal with mine warfare tactics. Finding and identifying sea mines and other objects on the ocean floor is a difficult and time-consuming task. Presently, one of the best ways to "see" the ocean floor is by reflecting sound off the bottom, much the same way light reflects off a surface, and then forming an "image" from the sound waves which are reflected back. A side scan sonar is a device which can be towed above the ocean floor while it scans the bottom, making images either for a person to see, or for a computer program to analyze.
The images formed from the echoes off the bottom of the ocean are not very clear. When a side scan sonar pings, an underwater object moored or sitting on the bottom will prevent sound from the sonar from reaching the sea floor for some distance beyond the object. This produces a highly localized highlight and shadow in the signal. A line of sensors then detects these signals, and an image is formed by plotting intensity versus time-of-arrival.
|
Figure 1. A remotely-piloted vehicle towing a side scan sonar. |
Figure 2. Example side scan sonar image. |
The height of the vehicle from the bottom, the length of the shadow and where the highlight is with respect to the shadow can be used to decide if the highlight is from an object on the bottom or from the edge of a trench on the bottom. In figure 1, a remotely piloted vehicle towing a side scan sonar is shown pinging at a rock on the bottom. Figure 2 illustrates two situations: a) there is an object on the bottom or b) there is a trench. Both produce a highlight and a shadow. As can be seen in the figure, the highlight, indicated by the black vertical bar, precedes the blue shadow for the object on the bottom whereas it follows the blue shadow for the trench.
Typical the images contain many objects that look like mines. Since the analyst only sees highlights and shadows, many objects such as rocks, trenches, fishing pots, and other debris obscure mines or appear to be mine-like themselves. In addition, because of the volume of information in the side scan sonar images and the inexactness of these images, it would be easy for even an expert to miss a mine. Consequently, a computer program to locate and enhance areas where mines might be analyzes the images. There are several approaches to accomplishing this. A digital image is made up of dots or pixels. The gray level of the pixel is determined by the digital value assigned. If large values corresponded to white dots and zero to black, then a cluster of large values might correspond to a highlight. One approach is select a small portion of the image using a sliding window and apply a one-for-one comparison of the pixels to an image obtained from a sample mine. The process continues until the entire image is scanned. Typically the comparisons are made on a library of sample mines to account for variability in possible mine images. Another approach is to have a computer program search through an image for a highlight, i.e., a cluster of bright pixels, and measure its length and width in pixels. The next step is to search around the highlight for a cluster of low values corresponding to a shadow and measure how many pixels wide and long the shadow is and where it is located with respect to the highlight. These measurements serve as clues. Using a technique known as pattern recognition, the clues are compared to a range of measurements a typical mine is likely to produce.
The most significant difference between the techniques is that the comparison technique compares the images pixel for pixel, whereas the pattern recognition technique reduces the image segments to a set of clues and only compares the clues to those obtained from sample mines. This is a substantial reduction in the information compared, but its performance is highly dependent on the quality of the clues selected. A variation of the comparison process is to transform the image to a frequency representation of the image and make a comparison with a similarly transformed library of sample mines. This comparison technique of frequency representations is also referred to as the matched filter technique. The advantage of the frequency representation is that error due to misalignment of the centers of a sample image and the sample mines are reduced significantly. Here the scanning process is simplified; the image is represented as the sum of frequencies, which exactly characterize the variation in intensities in the horizontal and vertical directions. However, the disadvantage is that the image information is still distributed over as many frequency values as pixel values and all are required to complete the comparison.
A new technique known as the wavelet transform is similar to the frequency transform except that instead of representing the image as the sum of frequencies, it is represented as the sum of wavelets. To understand the wavelet transform, think of an orchestral concert. What we hear during the concert is the combined sound of the orchestra playing, but the concert actually consists of individual instruments playing loudly or softly at various times. When a composer composes, he may hear all the music in his head, but he writes out the music for the individual instruments. The frequency representation reduces the concert down to the music played by each instrument and the sound of each instrument down to the frequencies summed together to give each instrument its individual sound. The wavelet transform of the sounds from a concert is similar to that of the frequency transform except the elementary units are more complex than frequency. A wavelet might be thought of as equivalent to a note of a particular instrument. If you listened to a single wavelet, you could not only tell which note it was, but also the instrument that played it. Because it takes several frequencies to characterize a note from a particular instrument, you could identify the note from a single frequency but not the instrument. The frequencies and wavelets that signals can be constructed from are referred to as bases. When applied to an image, the wavelet transform produces a much more compact representation of the information.
When a transform is computed, the results consist not of the frequencies or wavelets but a set numbers which are the coefficients to be multiplied with the entire set of possible frequencies or wavelets to reconstruct any signal exactly. A frequency representation requires the majority of coefficients to reconstruct a good representation of the signal or image. An advantage of the wavelet transform is that the vast majority of coefficients are small and can be replaced with zeros and yet produce a good reconstruction of the signal or image.
The wavelet transform of the sounds from a concert is an attempt to do the same thing. It splits the sounds into contributions from various bases, or instruments. The contributions are denoted by a set of numbers called coefficients. The coefficients tell how much of a basis is to be used at a certain time, just like the composer with the instruments. It may be very hard for an untrained ear to hear a certain instrument which is playing when it is not supposed to, but by splitting the sounds into individual instruments and comparing them to what is correct, one can tell easily when an instrument is not supposed to be there.
To find a mine, a portion of the image is transformed to a test set of wavelet coefficients. The test set is compared to several sets of coefficients stored in what is called a library. Each set of coefficients in the library was made from either an example image which contained a mine, or from an example image which did not contain a mine. If the test set best matches a set in the library of a mine example, the test set is tagged as one containing a mine-like object. The advantage of this approach is that the wavelet representation is a very compact representation of the images being compared.