Electronic Removal of
Outdoor Microphone Wind Noise
Michael R. Shust - mshust@micro.ti.com
or mshust@flash.net
2950 Plantation Wood
Missouri City, TX 77459
James C. Rogers
California Maritime Academy
Mechanical Engineering Department
P.O. Box 1392
Vallejo, CA 94590-0644
Contact information during ASA meeting:
Evening of Monday, October 12, 1998 through evening of Tuesday October
13, 1998:
Norfolk Waterside Mariott Hotel
235 East Main St.
Norfolk, VA 23510
(757)627-4200
Alternatively a message can be left at (281)274-3944.
Popular version of paper 2pSPb3
Presented Tuesday afternoon, October 13, 1998
136th ASA Meeting, Norfolk, VA
Introduction
Wind noise sensed by microphones outdoors can significantly degrade acoustic signals. Wind noise is most often reduced by the use of a spherical foam windscreen. Spherical foam windscreens are commonly seen on top of a television reporter's microphone. These windscreens remove the annoying rumble that can be caused by wind. In the case of measurement microphones, where the goal may be to measure the acoustic signature of a vehicle, the purpose of the windscreen is to prevent wind noise from obscuring details of interest in the microphone signal.Foam windscreens are low cost and work very well over a broad frequency range, but they are not perfect. First of all, they do not work well at low frequencies below about 15 Hz. This frequency range contains important details related to a vehicle's acoustic signature even though people cannot hear it. Second, the physical size of the windscreen, on the order of 10 cm in diameter, may be undesirable in some applications. And finally, the foam windscreen may become less effective at higher wind speeds, on the order of 40 MPH, due to turbulence caused by the interaction between the windscreen and the wind.
This research focused on an alternative method for reducing the wind
noise sensed by a microphone. A microphone senses both
wind noise and sound. What we want to do is pass just the sound and
reject the wind noise. The idea here is to sense the instantaneous
wind velocity near the microphone and predict the wind noise portion
of the microphone signal. Once we have this prediction, we can subtract
it electronically from the microphone signal and remove the wind noise
portion. The degree to which this is successful depends upon how
good our prediction is and this depends upon the strength of the wind velocity
to microphone pressure relationship and on how well a linear system fits
between the wind velocity and microphone signals.
How it Works
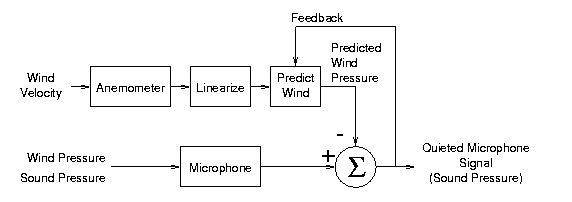
The wind prediction involves converting the velocity signal sensed by the hot wire anemometer into a pressure signal sensed by the microphone. This prediction involves significant mathematics and is most easily implemented on a Digital Signal Processor or DSP. For this research, the wind prediction is based upon empirical data collected real-time outdoors, rather than an analytical relationship determined from fluid mechanics theory. The analytical fluid mechanics approach is very unwieldy in this application and previous researchers have had only limited success using it in wind tunnel situations. The problem is the analytical Navier-Stokes equations are so difficult to solve that a solution is generally only possible after they have been simplified to the point where they no longer adequately describe the relationship between wind velocity and wind pressure.
As stated above, the relationship from velocity to pressure in this research is determined empirically in real-time using actual outdoor microphone/anemometer data. The technique essentially linearizes the relationship between the anemometer and microphone signals using a model based upon the Bernoulli equation and then utilizes statistical signal processing methods to perform the remainder of the wind pressure prediction. The feedback of the output shown in Figure 1 is used to drive the Predicted Wind Pressure signal in such a away as to minimize the Quieted Microphone Signal energy. The "Predict Wind" block learns the relationship between the anemometer and microphone signals. The anemometer only senses wind velocity and this prevents the Predicted Wind Pressure from containing sound pressure components, thus the electronic windscreen cannot remove significant sound pressure components from the microphone signal.
The quality of the prediction, and hence the electronic windscreen's
performance, depends on the amount of microphone wind noise information
that can be collected by the anemometer. The microphone
senses wind noise over a much larger region than the anemometer.
For this work the microphone was 12.7 mm (0.5") in diameter and the hot
wire anemometer was a small diameter wire, approximately 1.5 mm (0.06")
long. Therefore, it is possible to improve the electronic windscreen
performance by using multiple hot wire anemometers to collect more
microphone wind noise information. Note also that the anemometers
can only sense the wind pressure at the microphone due to the local
interaction between the microphone and the flow. Some of the microphone
wind noise is due to wind pressure fluctuations that are essentially unrelated
to the wind velocity fluctuations near the microphone. The electronic
windscreen cannot remove this component of the microphone wind noise.
Some Experimental Results
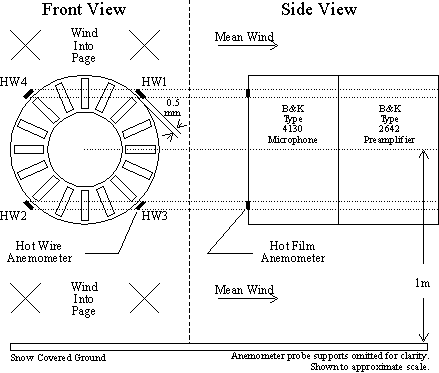
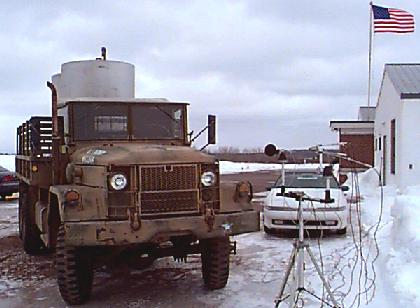
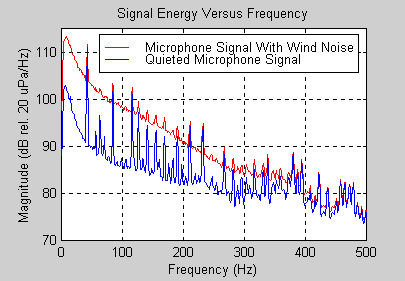
As stated above, multiple anemometer channels can improve the performance of the windscreen. The electronic windscreen was implemented using four anemometers mounted around the perimeter of the microphone diaphragm as shown in the photo in Figure 2. Figure 3 shows a diagram of the micophone/anemometer spacing. Figure 4 shows a photograph of the overall experiment. The microphone/electronic windscreen was mounted on a tripod along with a microphone fitted with a standard foam windscreen. A large idling truck was parked nearby to provide a sound source. The wind speed was approximately 10 MPH and its direction is indicated by the flag in Figure 4. Figure 5 shows the frequency domain results of the experiment.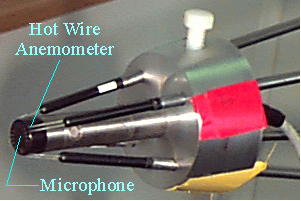
There is a simpler way to evaluate the performance of the electronic windscreen -- listen to the results. The following wav files playback at 2x speed so that typical low cost speakers can reproduce the low frequency wind and vehicle sounds:
![]() NoisyMic.wav
consists of a 5 second sample of the raw microphone signal corresponding
to the red plot in Figure 5. You will hear the mechanical sound of
the truck as well as the rumbling sound of the wind.
NoisyMic.wav
consists of a 5 second sample of the raw microphone signal corresponding
to the red plot in Figure 5. You will hear the mechanical sound of
the truck as well as the rumbling sound of the wind.
![]() PredWind.wav
consists of a 5 second sample of the predicted microphone wind noise.
In this file you will only hear the prediction of the wind noise sensed
by the microphone and not the truck. This signal was derived
completely from the hot wire anemometers. Notice that it sounds like
the wind noise component of NoisyMic.wav.
PredWind.wav
consists of a 5 second sample of the predicted microphone wind noise.
In this file you will only hear the prediction of the wind noise sensed
by the microphone and not the truck. This signal was derived
completely from the hot wire anemometers. Notice that it sounds like
the wind noise component of NoisyMic.wav.
![]() QuietMic.wav
consists of a 5 second sample of the Quieted Microphone Output and corresponds
to the blue plot on Figure 5. This signal is the output of the electronic
windscreen and is actually the result of subtracting PredWind.wav
from NoisyMic.wav . Notice here that the
wind noise is diminished significantly, yet the truck sound has not been
attenuated.
QuietMic.wav
consists of a 5 second sample of the Quieted Microphone Output and corresponds
to the blue plot on Figure 5. This signal is the output of the electronic
windscreen and is actually the result of subtracting PredWind.wav
from NoisyMic.wav . Notice here that the
wind noise is diminished significantly, yet the truck sound has not been
attenuated.
Conclusion
This research resulted in the first successful reduction of outdoor microphone wind noise using nearby wind velocity measurements. Overall performance is less than the spherical foam windscreen for the low speed case (sub 20 MPH) and the foam ball is hard to beat in terms of complexity and cost ($0.50 home-made, $50 for an "expensive" one). Thus, the electronic windscreen is limited to applications not suited to the spherical foam windscreen.In addition, the electronic windscreen has value in determining the sources of wind noise in spherical foam wind screened microphones. It was found during this research that the spherical foam windscreen removes almost all of the local interaction between the screened microphone and the air flow. This has two important implications: 1) It is unlikely that the foam windscreen can be modified to make it perform significantly better (even by making it very large), and 2) It is unlikely that an electronic windscreen based upon velocity measurements will exceed the performance of a foam windscreen.
While it was discovered that the spherical foam windscreen performs better than the electronic windscreen at low speeds, it is not known if this is true at higher wind speeds such as when a microphone is mounted to the outside of a moving vehicle. The direction of future work is to utilize more than four anemometers, test other microphone/anemometer orientations, and to test the electronic windscreen at higher wind speeds.