University of Leipzig
Institute for Meteorology
Stephanstr. 3
D - 04103 Leipzig
Germany
Popular version of paper 5pPAa1 (and 5pPAa11)
Presented Friday afternoon, March 19, 1999
ASA/EAA/DAGA '99 Meeting, Berlin, Germany
Introduction
In this paper, acoustic travel time tomography, a technique usually used in geophysics and oceanography, is proposed and demonstrated as a method for remote monitoring of the atmosphere near the ground over many types of terrain. Tomography is a technique for obtaining 2-D cross sections or 3-D pictures of the innards of an object, by shining an energy source (such as sound waves or x rays) on the object and measuring how the object absorbs or scatters the energy source. Perhaps the most familiar example of tomography is the medical CAT scan, in which shining x-rays at the skull from different angles can reveal the presence and even the three-dimensional shape of a tumor inside the skull. Tomography can also be performed on inanimate objects, such as the atmosphere, and with sound waves taking the place of x rays. For the special case of acoustic tomography, one must measure travel times of acoustic signals on different ray paths between acoustic sources and receivers. By analyzing these measurements, one can ultimately build 3-dimensional maps of temperature and wind at different points in the atmosphere.
Theory
The observed data set consists of an analysis of the acoustic travel times, which contain information about the meteorological quantities of the medium along a specified path. One such method of analysis, known as the Simultaneous Iterative Reconstruction Technique, (SIRT) requires only small computational requirements, as well as simple handling during online evaluation. Straight lines connecting the sound source and the receiver are used to approximate the true path of the sound rays. Because the number of measurements is limited, the tomographic array was divided into square grid cells. The size of the grid cells had to be chosen so that on one hand, each cell is crossed by a sufficient number of rays, and on the other hand, the desired resolution for the measurement of meteorological quantities is achieved. For each grid cell constant values of the effective sound speed were assumed. An image of diverse properties of the domain (which was radiated through from several angles of view) can be deduced by a data- inverting technique (i.e., SIRT).
Experimental Design
Travel time measurements between sources and receivers placed around an array of 260*200 m-2 at the test site Melpitz near Leipzig (Free State of Saxony, Germany) were carried out to obtain area averaged meteorological quantities (see Fig. 1).
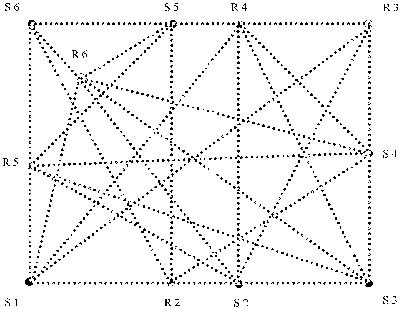
Fig. 1: Layout of the measuring field during MEPEX 98
.
During the measuring campaign MEPEX 98 (MElPitz EXperiment) in November
1998, travel time data were measured by 6 acoustic sources S1...S6 (2 m
high, Fig. 2) and 5 receivers R2...R6 (4.5 m high, Fig. 3).
All sources simultaneously transmit an acoustic signal. The signal
is a sine-wave oscillation with a double peak and a duration in each case of
4 ms (constant frequency of 1000 Hz). Using this special signature at unsatisfactory
signal/noise ratios, a clear identification of the transmitted signal at
the receivers is possible. The duration of the signal was chosen to be
very short to prevent overlapping of different signals. To ensure the synchronization
of all devices the function generator is additionally connected with all
data loggers, and gives the start signal for registration.
To obtain relevant meteorological data, different requirements are obligatory.
The travel time measurements have to be carried out with a high degree
of accuracy. All connected instrumentation must be synchronized and the distance between sound source and
receiver precisely determined.
| Fig. 2: The speaker system (compression driver, amplifier, portable battery supply). | Fig. 3: One receiver set (microphone at aprolonged tripod and a data logger). |
Results
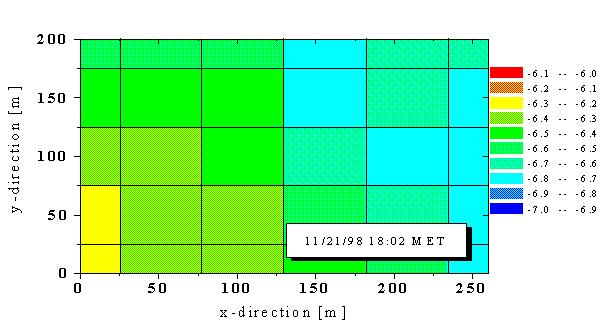
Area-averaged values of the temperature (see figure 4),
with one value for each grid cell, were calculated with the travel time
data from the introduced experimental campaign. Acoustic tomography can
therefore described as a technique for remotely monitoring meteorological
quantities, to complete conventional point measurements over different surfaces.
Principal daily temperature trends with a temporally high resolution
of 30 s up to 1 min as well as inhomogeneities in the meteorological fields
due to, e.g., a different heating of the ground surface are visible. This
indicates that, it is possible to apply the presented tomographic method
to detect inhomogeneities in the landscape, especially, during meteorological
field experiments.
On the other side, the calculated tomograms are necessary means for
the validation of numerical atmospheric models. The tomographic method
can directly produce area averaged values of meteorological quantities
and therefore rather consistent data will be obtained for the model validation.
Fig. 4: Tomogram (horizontal slice) of area-averaged temperatures
[°C] for the grid cells of the test field,
representing a volume average between the height of 2
m and 4.5 m.