
Hearing Comfort in Classrooms:
How Much Difference Does Design Make
Abigail Stefaniw - stefaa@alum.rpi.edu
Advisor: Professor Yasushi Shimizu
Architecture Department
Renesselaer Polytechnic Institute
110 8th Street
Troy, NY 12180
Popular version of paper 5aAA1
Presented Friday morning, June 8, 2001
141st ASA Meeting, Chicago, IL
In a quest for standardized quality in speech intelligibility, legislators and acoustic researchers have proposed many different classroom standards. These standards are based on various statistical measures of speech intelligibility, including the Speech Transmission Index (STI) the Signal to Noise Ratio, the background noise level (given in NC rating or dB(A)), and the Intelligibility Level given in percentage of words heard correctly. All of these objective measurements either calculate the loudness of speech compared to distracting noise, or the percentage of words heard correctly by the average listener. They do not directly take into account the listener's comfort or concentration level.
| Name | RT (seconds) | Signal/Noise Ratio (dBA) | NC |
| A. | 0.4 | +15 | 30 |
| B. | 0.6 | +20 | 25 |
| C. | 0.8 | +5 | 40 |
This study defines Ease of Hearing as a measurement of the listener's comfort and concentration level. It is determined by giving listeners a subjective comparison test in which they rate the ratio of consonants or words they feel they need to guess at, the effort they expend in concentration, and their overall comfort in the sound environment.
Ease of Hearing is particularly important for children in the classroom. If the sound environment requires them to be uncomfortable and expend extra energy to concentrate on the words, students will be easily distracted and will not learn as effectively as they would in an ideal environment.
Therefore, this study aims to develop Ease of Hearing as an initial indication of acoustical comfort, and to investigate what kind of classroom could produce an ideal sound environment. To this end, three differently shaped classrooms were simulated using CATT Acoustics software. The classrooms were designed with appropriate amounts of sound diffusive and absorptive materials to reach the acoustic standards in the table above. The plans of the classrooms used are shown below.
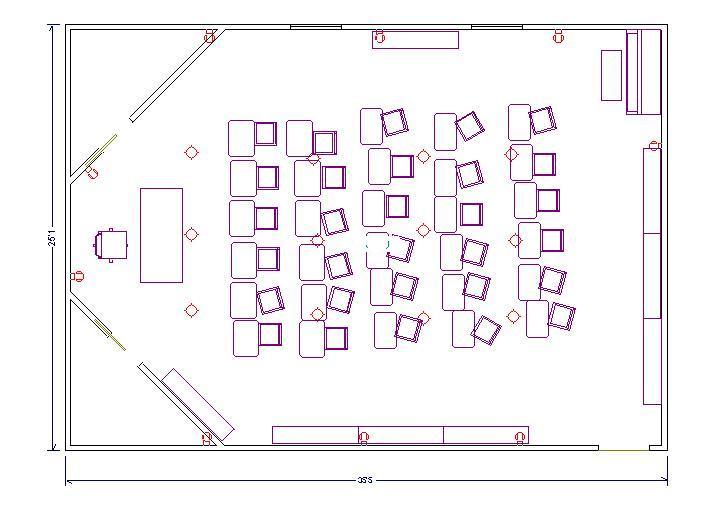
Classroom 1:
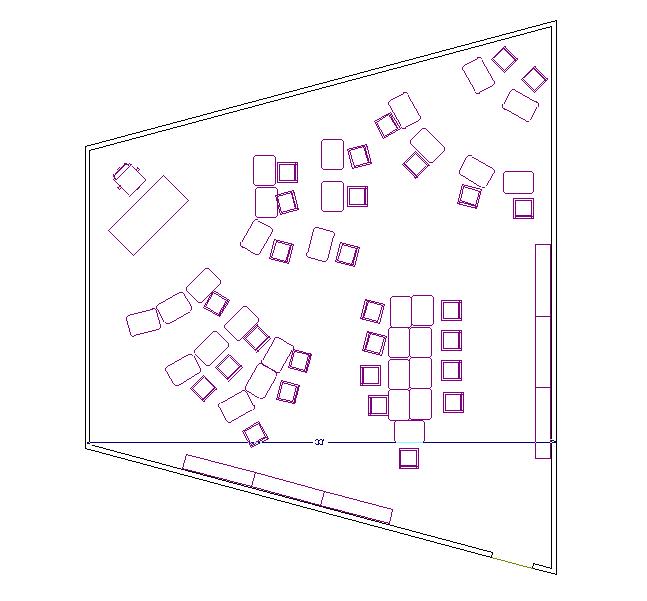
Classroom 2:
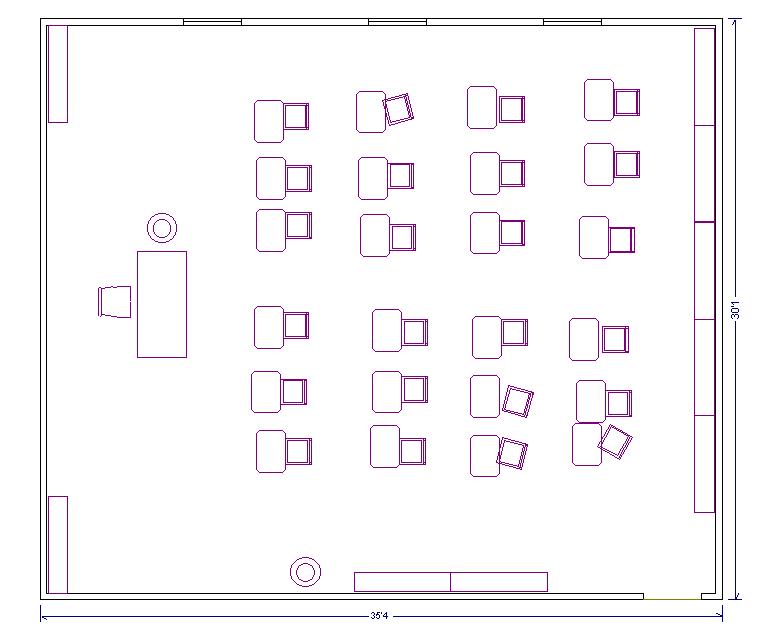
Classroom 3:
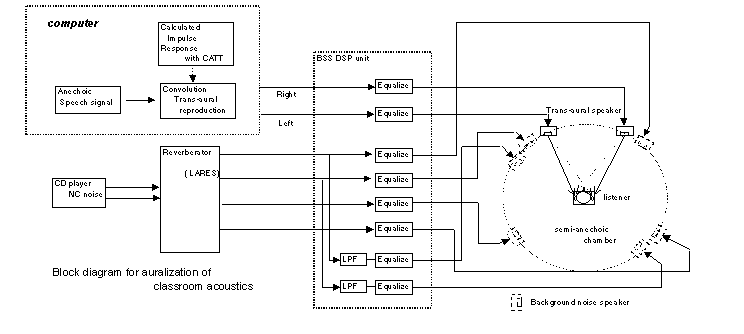
These classrooms were each designed with three different proposed acoustics standards for classrooms. The nine simulations produced by these combinations were used to calculate the acoustic response of each room condition. This response was combined with 'dry' recorded speech to produce an auralization of each classroom, or sound 'visual'-ization. These auralizations were played through speakers in an anechoic chamber, using the following signal processing set up. Unfortunately, the auralizations need to be played under these conditions to perceive the difference between each room.
| Table 2: Combinations of Geometry and Acoustical Criteria | |||||||||
| Criteria | A | B | C | A | B | C | A | B | C |
| Geometry | 1 | 1 | 1 | 2 | 2 | 2 | 3 | 3 | 3 |
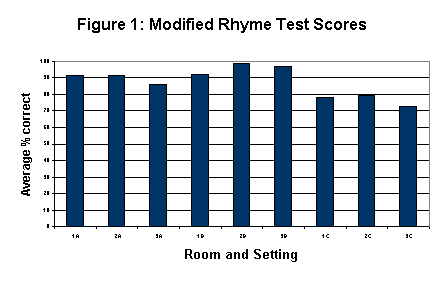
The auralization was used to administer a standard statistical intelligibility test (the Modified Rhyme Test) and the Ease of Hearing test to various young listeners with good hearing. The tests were given using calibrated speakers with the proper filters to simulate a realistic classroom sound situation at the listener's ear. The information was compiled to give a comparison between the various classroom arrangements using both the intelligibility test data (percent of words correct) and the Ease of Hearing data.
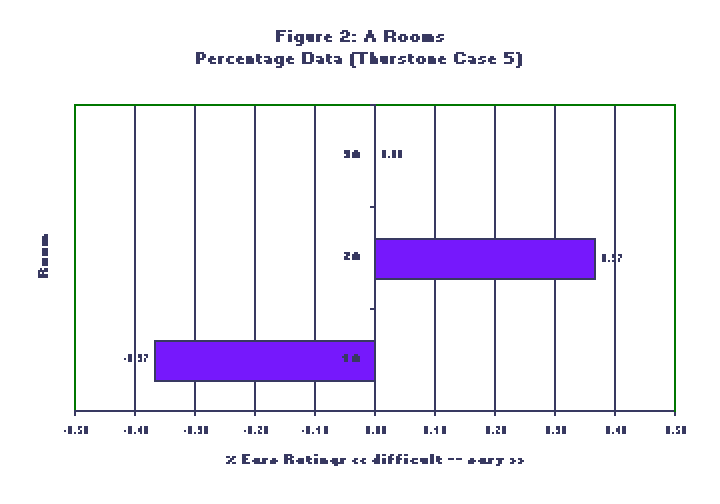
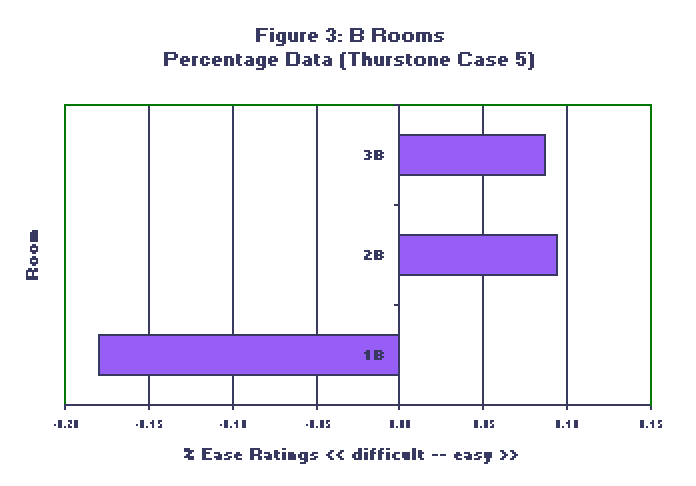
It is interesting to note that the trapezoidal classroom, 2, is generally rated much higher than the other two geometries, except the standard rectangular classroom 3 with the lowest noise level, B. The difference between Rooms 2B and 3B shows up only in the Ease of Hearing data. Only in room 2 is the sound source, the teacher's location, placed in corner. This implies that architectural design, especially of wall shape, does influence the clarity of speech.
This information allows an architecturally realistic evaluation of the materials
and geometry needed for high-intelligibility speech communication in learning
spaces. It also allows comparison of the two test types. The Ease of Hearing
data shows a very good correlation with the intelligibility data, in that they
agree on which simulations produce the best and worst speech conditions. The
Ease of Hearing test, is also, as expected, a more sensitive measure of acoustic
quality than the percentage of words heard or guessed correctly.