
David A. Schwartz- schwartz@neuro.duke.edu
Catherine Howe
Dale Purves
Center for Cognitive Neuroscience
Duke University
Durham, NC 27708,
(919) 684-6276
Popular version of paper 5aPP4
Presented Friday morning, May 2, 2003
145th ASA Meeting, Nashville, TN
The term consonance refers to the harmoniousness or pleasantness of the
sound produced by playing two musical tones simultaneously. Consonance ordering
refers to the relative consonance of different chromatic scale tone combinations.
For example, the combination of the notes C4 and F4, called a "fourth" in musical
terminology, is typically judged more consonant than the combination of notes
C4 and bG4, called a "tritone" (Figure 1). Figure 2 shows the average
consonance rank listeners assigned to each of the 12 possible chromatic scale
tone combinations in research conducted during the late 19th and early
20th centuries. The studies all agree that the musical intervals of the
octave, the fifth, and the fourth are the most consonant, followed by the major
sixth and major third, the minor second and major seventh being least consonant.
Remarkably, listeners of all ages, places, and historical periods tend to produce
this same general consonance ordering, suggesting that it has a basis in some
fundamental property of audition. Despite scientific interest in this phenomenon
dating back at least 2500 years, this aspect of hearing has no generally accepted
explanation in either physiological or psychological terms.
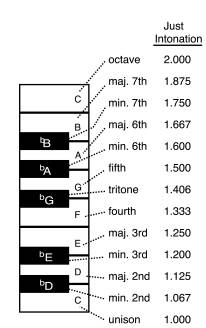
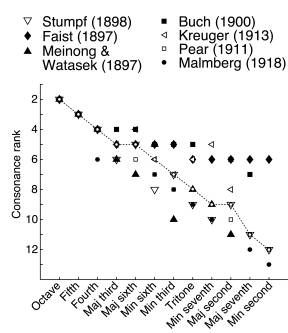
Figure 2. The consonance ordering
of musical intervals. Graph shows the consonance rankings assigned to each of
the 12 chromatic scale tone pairings in the seven studies reported by Malmberg
(1918). The median consonance values are indicated by the open circles connected
by a dashed line. The octave (e.g., C4 and C5) is judged the most consonant
and the minor second (e.g., C and bD) is judged the least consonant.
Most previous efforts to explain why human listeners experience tone combinations
as relatively pleasant or unpleasant have focused on the physical properties
of sound stimuli, their frequency characteristics in particular. Helmholtz,
for example, equated consonance with the "smoothness" of a sound, and suggested
that a loss of smoothness occurs when the overtones (i.e., harmonics) of two
different notes physically interfere with each other. Terhardt has argued more
recently that smoothness is only part of the story, and that listeners acquire
a sense of musical intervals by learning the abstract pitch relationships in
speech sounds. While such theories have been successful in explaining some aspects
of consonance, neither can account for all the phenomenology of tone perception.
Instead of focusing exclusively on the properties of the sound wave at the
ear or on the frequency ratios that define musical tone combinations, we have
approached the problem of consonance from the perspective of the auditory system's
need to contend with the inherent ambiguity of all acoustical stimuli. A given
variation in sound pressure can arise from many different combinations of initiating
mechanical force, physical properties of the resonant body or bodies acted upon,
and qualities of the medium and structural environment intervening between the
source and the listener. This uncertainty presents a quandary, since listeners
must direct appropriate behavior toward objects and events that are not specified
by the sound pressure variations at the receptor surface. We therefore reasoned
that the brain must generate the sounds we hear based upon the relative likelihood
of the different possible sources of a given acoustical stimulus.
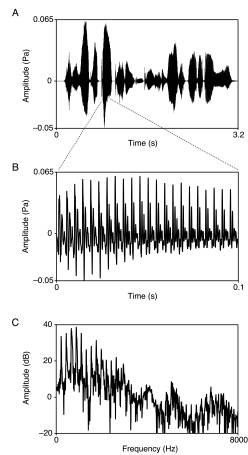
Figure 3 Analysis of speech segments.
A) Variation of sound pressure level over time for a representative utterance
from the TIMIT corpus (the sentence in this example is "She had your dark
suit in greasy wash water all year". B) Blowup of a 0.1 second segment
extracted from the utterance (in this example the vowel sound in "dark"). C)
The spectrum of the extracted segment in (B), generated by application of a
fast Fourier transform. All amplitude and frequency values in a given spectrum
were normalized according to. Fn= F/Fm and An=
A/Am, where Am and Fm are the maximum amplitude
and its associated frequency, A and F are any given amplitude and frequency
values in the spectrum, and An and Fn are the normalized
values. This method of normalization avoids any assumptions about the structure
of human speech sounds, e.g., that such sounds should be conceptualized in terms
of ideal harmonic series.
Since human speech sounds are the principal naturally occurring sources of
tone-evoking stimuli, we examined a database of recorded speech sounds in ten
languages to ask whether the median consonance ordering in Figure 2 is predicted
by the statistical distribution of sound energy in the periodic stimuli that
human listeners normally encounter. Figure 3 illustrates the method we used
to analyze a corpus of recorded American English speech sampled from the DARPA-TIMIT
Acoustic-Phonetic Continuous Speech Corpus (Garofolo et al., 1990); Figure 4
presents the "statistical spectrum" resulting from this analysis,
showing the average relative amplitude that occurs in speech sounds at different
frequency ratios relative to the maximum amplitude in a spectrum.
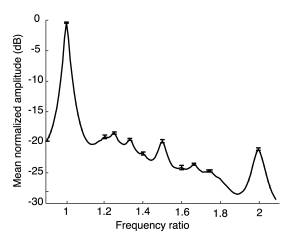 Figure 4. Statistical characteristics
of American English speech sounds based on an analysis of the spectra extracted
from the >100,000 segments (200 per speaker) in the TIMIT corpus. Mean normalized
amplitude is plotted as a function of normalized frequency, the maxima indicating
the normalized frequencies at which power tends to be concentrated. The plot shows
the statistical spectrum for the octave interval bounded by the frequency ratios
1 and 2. Error bars show the 95% confidence interval of the mean at each local
maximum.
Figure 4. Statistical characteristics
of American English speech sounds based on an analysis of the spectra extracted
from the >100,000 segments (200 per speaker) in the TIMIT corpus. Mean normalized
amplitude is plotted as a function of normalized frequency, the maxima indicating
the normalized frequencies at which power tends to be concentrated. The plot shows
the statistical spectrum for the octave interval bounded by the frequency ratios
1 and 2. Error bars show the 95% confidence interval of the mean at each local
maximum.
The frequency ratios at which sound energy is concentrated in speech sounds accord with the fundamental frequency ratios that define the chromatic scale intervals (Figure 5). Moreover, the difference in the amount of sound energy concentrated at each frequency ratio predicts the consonance ordering of chromatic scale tone combinations (Figure 6).
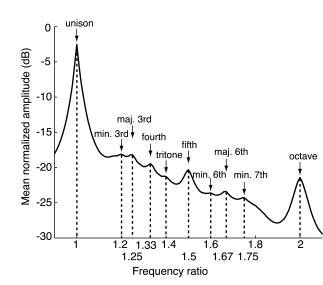
Figure 5. Comparison of the normalized spectrum of human speech sounds and the intervals of the chromatic scale. The majority of the musical intervals of the chromatic scale (arrows) correspond to the mean amplitude peaks in the normalized spectrum of human speech sounds, shown here over a single octave. The names of the musical intervals and the frequency ratios corresponding to each peak are indicated. The frequency ratios at the local maxima closely match the frequency ratios that define the chromatic scale intervals (see Figure 1).
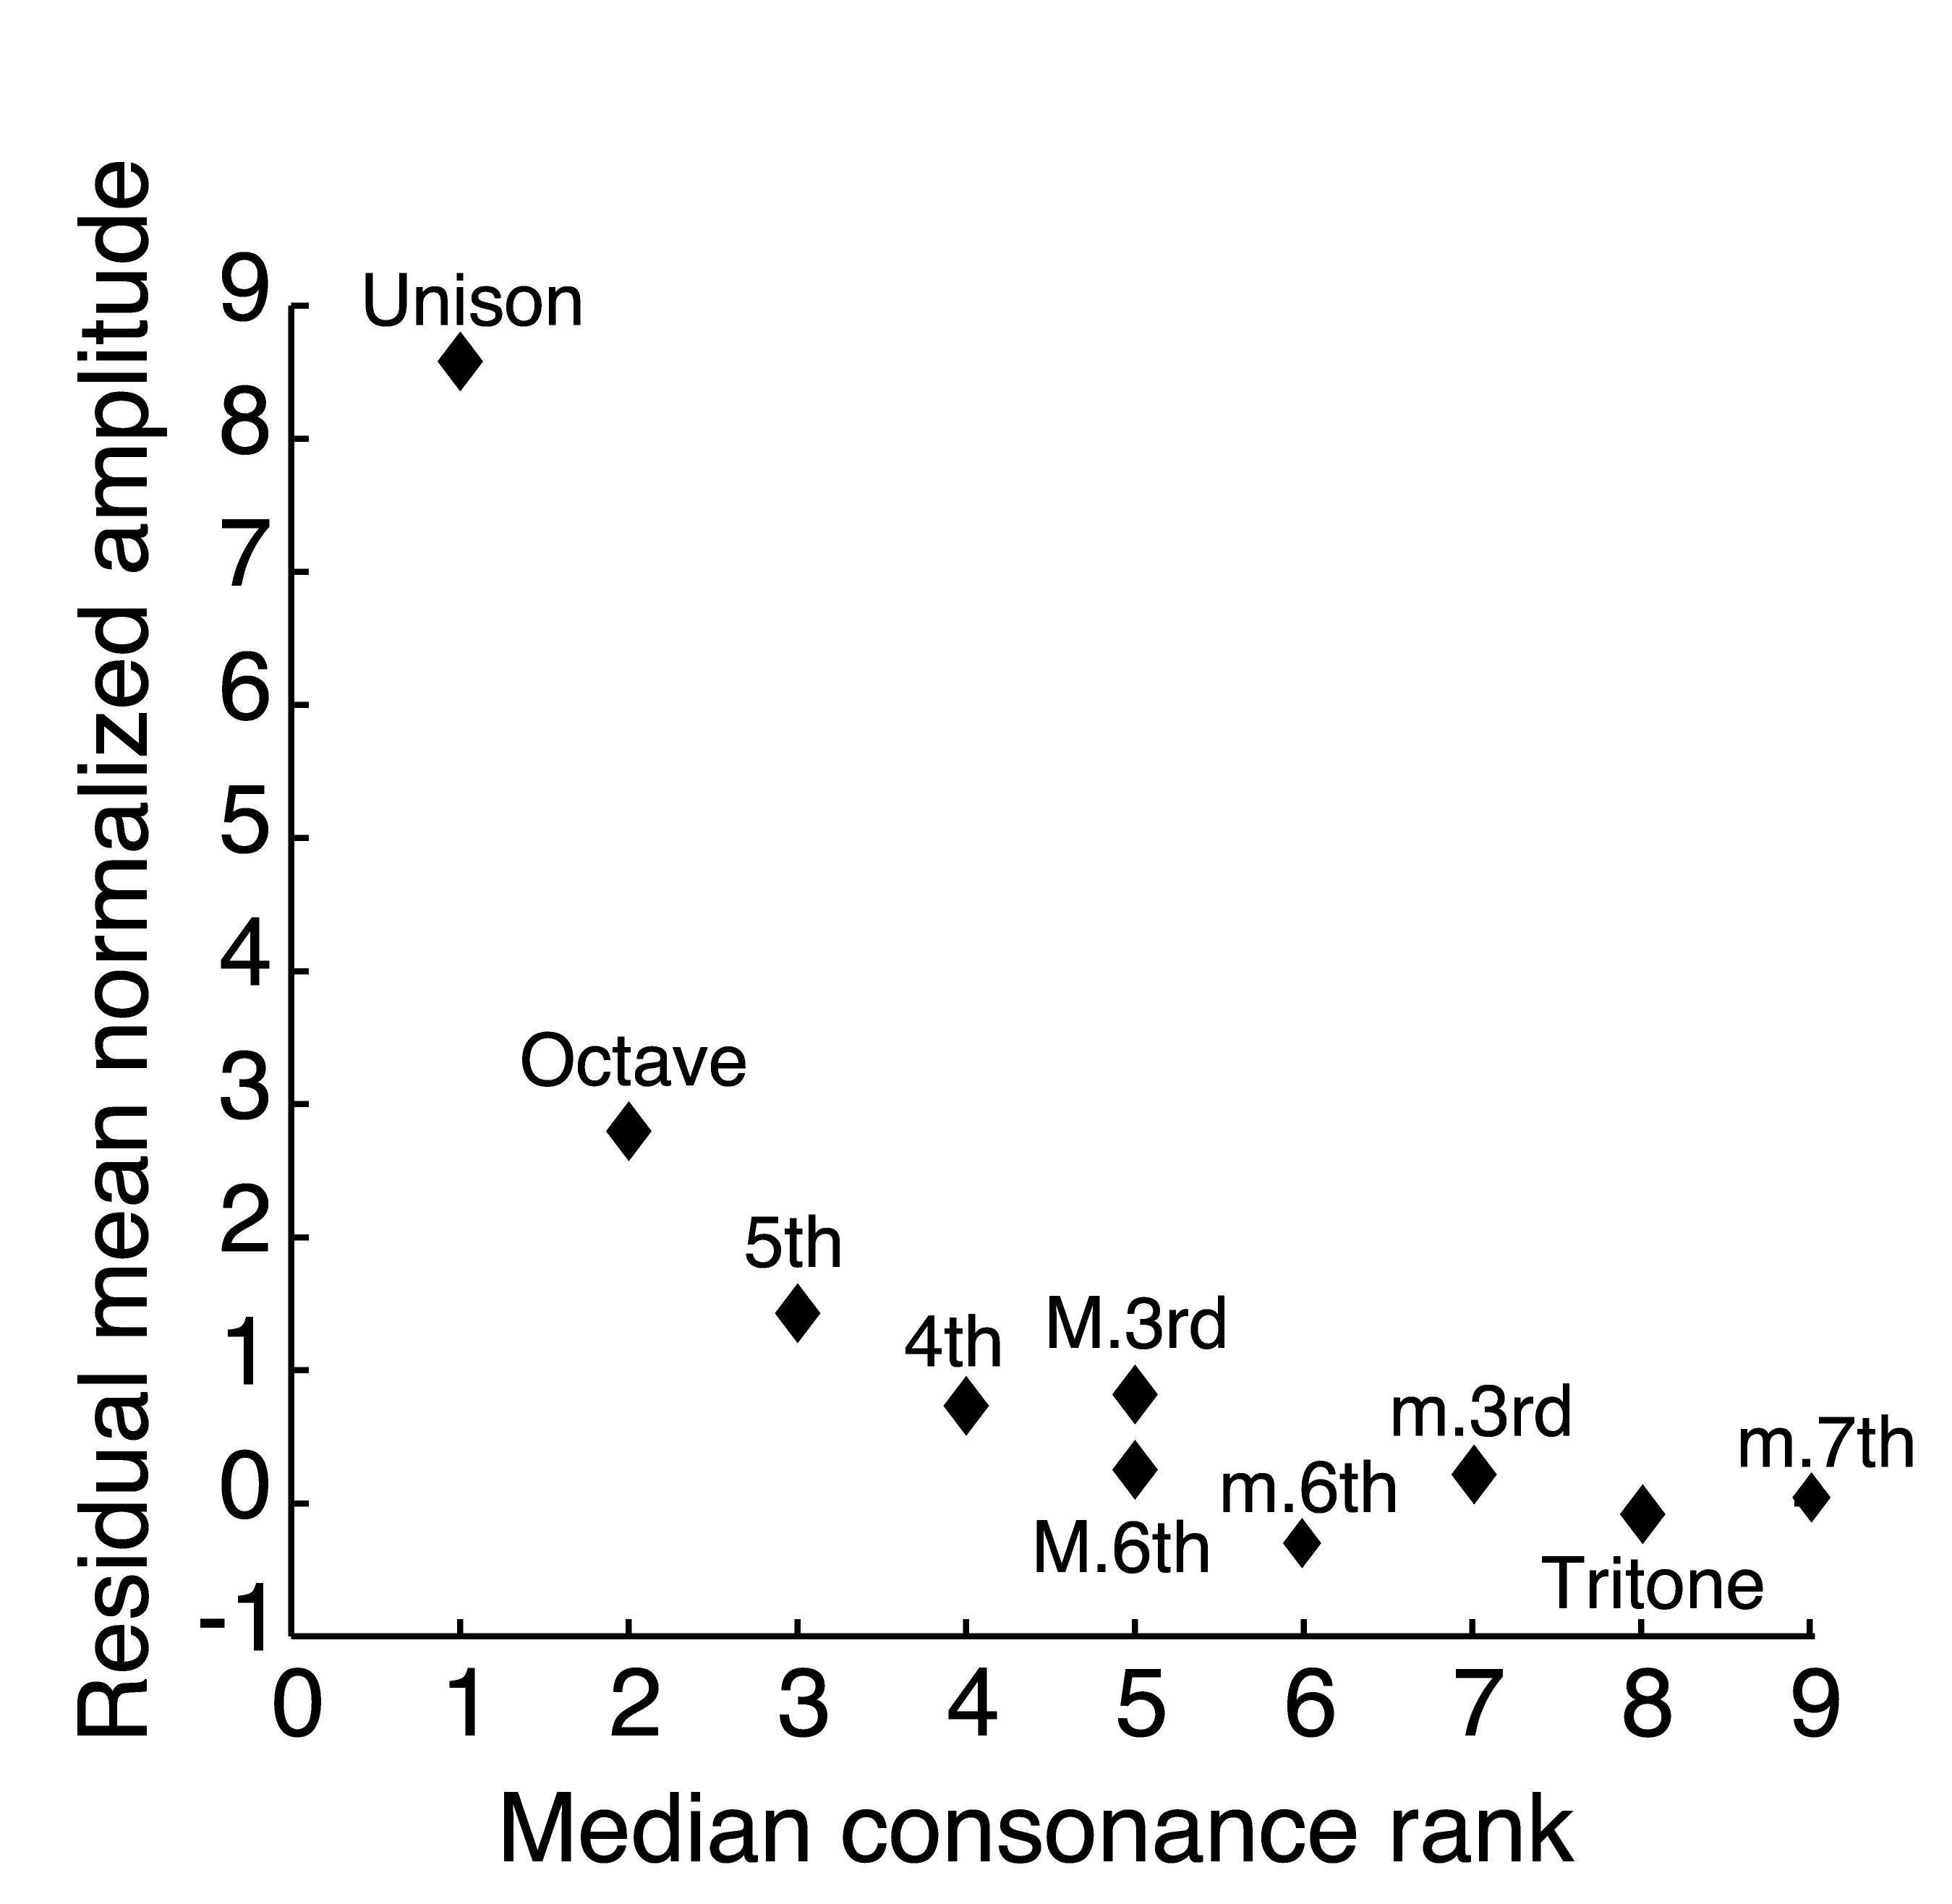
Figure 6. Consonance rankings
predicted from the normalized spectrum of speech sounds. Median consonance rank
of musical intervals (from Figure 2) plotted against the residual mean normalized
amplitude at different frequency ratios, Consonance rank decreases progressively
as the relative concentration of power at the corresponding maxima in the normalized
speech sound spectrum decreases.
These observations support the hypothesis that the perceptual response to periodic sound stimuli is determined by the statistical relationship between ambiguous acoustical stimuli and their various possible natural sources and suggests that other puzzling aspects of tone perception may be explainable in similar terms.
References
Garofolo JS, Lamel LF, Fisher WM, Fiscus JG, Pallett DS Dahlgren NL (1990) DARPA-TIMIT Acoustic-phonetic continuous speech corpus [CD-ROM]. Gaithersburg, MD: US Department of Commerce.
Malmberg CF (1918) The perception of consonance and dissonance. Psychol Monogr 25: 93-133.
Schwartz DA, Howe CQ and Purves D (2003) The statistical structure of human speech sounds predicts musical universals. J Neurosci 23: 7160-7168.