
Ronald H. Silverman, Ph.D. - ros2012@med.cornell.edu
D. Jackson Coleman, M.D.
Dan Z. Reinstein, M.D.
Department of Ophthalmology
Weill Medical College of Cornell University
1300 York Ave. A855
New York, NY 10021
Frederic L. Lizzi, Eng.Sc.D.
Riverside Research Institute
156 William St.
New York, NY 10038
Popular version of paper 1aBB4
Presented Monday morning, May 24, 2004
147th ASA Meeting, New York, NY
Summary:
High-frequency ultrasound combined with sophisticated signal processing has
opened new avenues for imaging and precisely measuring the human eye. This new
combination has improved diagnosis, treatment planning and follow-up evaluations
for surgical procedures to correct vision. The paper below discusses corneal
maps, gathering 3-D data, and using a new geometry to show the inside of the
eye.
Introduction:
The human eye is a small but highly complex organ. It is the seat of vision
and provides our chief window upon the world. The eye can be damaged by trauma
or disease, including glaucoma, tumors, diabetes, infection and diseases of
aging such as cataracts and macular degeneration.
When confronted with a diagnostic problem, the ophthalmologist has access to
optical instrumentation, such as the slit lamp and ophthalmoscope. However,
in some situations a good view of the eye can be limited by opacities such as
corneal scars, cataracts or hemorrhage. In addition, certain parts of the eye
cannot be visualized optically because of other intervening tissues.
Ultrasound allows us to depict the eye's anatomy and pathology without subjecting
it to ionizing radiation that could damage the lens, retina or optic nerve.
Since diagnostic ultrasound's introduction in the 1950's, enormous progress
has been made in the technology's sensitivity, resolution and biometric precision.
This report will describe some of the latest developments of our ophthalmic
ultrasound research group.
Ophthalmic ultrasonography was until recently performed almost exclusively
at a frequency of 10 MHz. This frequency was relatively easy to achieve and
process in commercial instrumentation, and provided a reasonably good image
of the globe and orbital tissues. In the early 1990's, however, ultrasound transducers
(the element that emits and receives acoustic energy) with frequencies of 50
MHz or higher were developed, along with suitable electronic components for
signal processing. As the frequency increased, the resolution improved, and
this technology was soon applied to imaging the anterior segment of the eye.
Our laboratory has developed some specialized innovations in the field of high-resolution
ultrasound imaging of the eye, emphasizing precision visualization and biometry.
A New Way of Making Images
Two-dimensional ultrasound images are produced by scanning an ultrasound beam
across a tissue. If the ultrasound beam hits a surface perpendicularly, an echo
is reflected towards the transducer. If the beam hits a surface at an oblique
angle, the echo is deflected away from the transducer and is not detected. Because
the surface of the eye is curved, a simple linear scan motion will result in
this type of deflection, resulting in loss of image quality. This led us to
develop a scanning system in which the transducer is moved in an arc matched
to the curvature of the front surface of the eye. Figure 1 provides an example
of an arc scan of the anterior segment of a normal eye. This approach was crucial
in enabling us to evaluate the cornea.
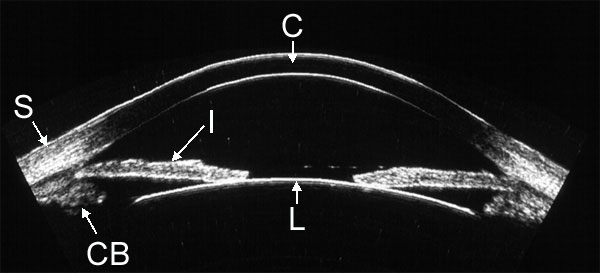 |
| Figure 1. High-resolution ultrasound image of the anterior segment obtained with arc-scan geometry. Visualized structures include the cornea (C), sclera (S) , iris (I), anterior lens surface (L) and ciliary body (CB). |
3-D Data to Look at the Eye
We also developed scanning systems that acquire a series of images, allowing
3-D image reconstruction and biometric analysis. Our systems store the radiofrequency
echo data in its raw form, a process that is not implemented in most commercial
instruments. Storing the raw echo data allows us to preserve the full information
content of the data and allows more precise measurement than could otherwise
be achieved.
We have used this method to diagnose disease in the front of the eye, such as
glaucoma, tumors, cysts, corneal scars and trauma. (Figure 2.)
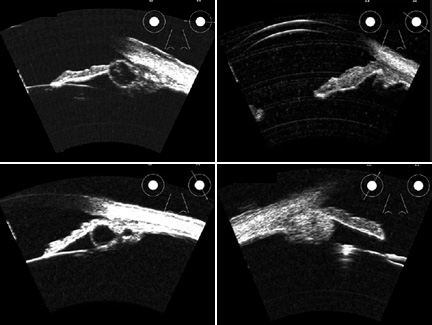 |
| Figure 2. High-resolution ultrasound images of space-occupying lesions, including iris cyst (upper left), iris malignant melanoma (upper right), retro-iridal cyst (lower left) and ciliary body malignant melanoma (lower right). |
By combining consecutive scan planes, it is possible to generate three-dimensional representations of the eye. Shown below is a 3-D animation of a high-resolution ultrasound scan of one quadrant of a rabbit eye.
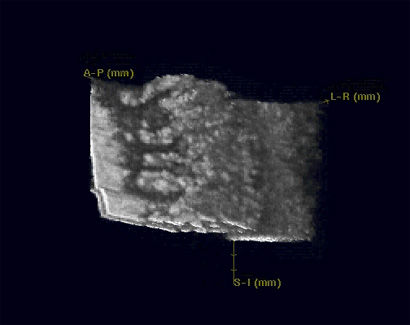 |
| Figure 3. Animation of 3-D, high-resolution reconstruction of one quadrant of the anterior segment of a rabbit eye. The radial structure of the ciliary processes can be appreciated far better in 3-D than in static images. (Double-click to activate; alternately, right-click on the image, save it to disk, and view it with Windows Media Player.) |
Preparing for LASIK with Corneal Maps
A special area of interest to our group is quantitative biometric evaluation
of the cornea, especially in surgical procedures such as LASIK.
3-D high-frequency ultrasound scanning allows us to measure the layers of the
cornea and generate color maps representing their thickness distribution. This
allows the clinician to determine if the cornea is thick enough for a surgical
procedure, can identify disease conditions, and can be used to evaluate any
abnormalities after surgery.
Measuring the thickness of these thin layers is important. In LASIK, a blade
is used to expose the stroma at a depth of about 0.16 mm in the central cornea.
A laser then vaporizes a specific thickness of stromal tissue calculated to
correct refractive error. Because the cornea is inherently transparent, ultrasound
is an invaluable tool not only for measuring its overall thickness, but measuring
the thickness of individual layers including the stroma (about a half millimeter
thick), the epithelium (about 1/20th of a millimeter thick), and the surgical
interface produced by LASIK within the stroma.
Figure 4 shows an ultrasound image of the cornea in cross section and corneal
layer thickness maps of a normal, untreated eye. An example of a cornea with
pathologic changes more than a year after LASIK treatment is shown in Figure
5.
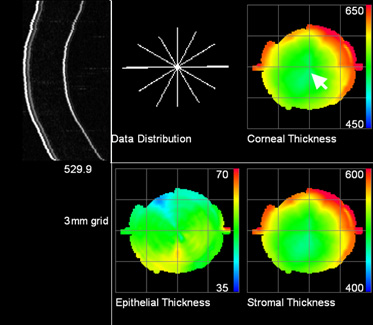 |
| Figure 4. Color maps representing the thickness of the layers in microns (thousandths of a millimeter) of a normal, untreated cornea. Maps were generated by analysis of a series of six scans arranged in a meridional series (Data Distribution), a single cross-section of which is shown on the upper left. |
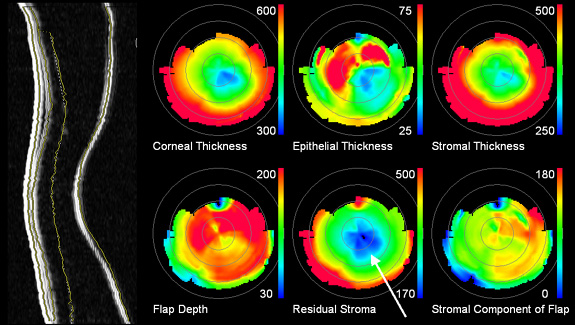 |
| Figure 5. Corneal layer thickness maps one-year after LASIK. The scan plane depicted on the left shows central corneal thinning and bulging, a condition resulting from excessive depth of the original treatment. The automatically detected boundaries are superimposed on the image. The color maps show that at its thinnest point (arrow), the stroma beneath the surgically induced interface is only 170 microns thick, whereas 250 microns is generally considered the minimum safe thickness value. |