Joel Mobley - jmobley@arl.army.mil
U.S. Army Research Laboratory
2800 Powder Mill Rd.
Adelphi, MD 20783
Tuan Vo-Dinh
Oak Ridge National Laboratory
PO Box 2008
Oak Ridge, TN 37831-6101
Brian J. Daley
University of Tennessee Medical Center
Knoxville, TN 37920
Martin C. Holland
San Francisco General Hospital
San Francisco, CA 94143
Popular version of paper 5aBB1
Presented Friday morning, May
28, 2004
147th ASA Meeting, New York, NY
Introduction
Traumatic brain injury is a leading cause of accidental death in North America for people under 45 years of age. Proper on scene assessment of head injuries is key to preventing serious secondary damage, and is also critical in directing the care of soldiers wounded in battle. From the American roadways to foreign battlefields, a portable, simple-to-operate device to non-invasively probe the brain for signs of acute injury would fill an urgent need in the struggle against head impact mortality. This paper describes one part of our larger effort to define the operating principle for such a device based on ultrasound technology. As part of this work, we have acquired transcranial (i.e., across the intact skull) ultrasound signals non-invasively from more than twenty human volunteers. These signals consist of the echoes and scattering from various structures inside the head, including the brain, skull, and scalp. In this brief report, we illustrate the complex structure of transcranial echo patterns using a representative signal from our patient population. With the aid of a computational model, we identify the physical composition of these signals with an eye toward exploiting the echoes to non-invasively characterize pathological conditions inside the cranium.
Background
Medical ultrasound usually conveys diagnostic information through formed anatomical images and blood flow maps. A complementary approach known as tissue characterization seeks to extract information from ultrasonic signals about the underlying physical properties of tissue in order to detect abnormalities or disease. Using this approach, our goal is to reduce the diagnostic information to a few essential parameters and provide a result that is straightforward to interpret. The presence of the skull has always presented a technical challenge to the non-invasive assessment brain injury. However, we seek to exploit the strong echoes that arise because of the skull as part of a measurement strategy to detect space-filling lesions inside the cranium.
Physics of transcranial propagation
When a transducer is placed just above the ear and launches a short burst of ultrasonic energy into the scalp, it initiates a process of reflections and reverberations that results in dozens of distinct echo pulses propagating inside the head. At each boundary between different tissues, an incoming pulse of ultrasound gets split into two outgoing components - one reflected and one transmitted. By the time the initial pulse has traveled halfway across the head to the midline of the brain, it will have left in its wake as many as twenty detectable echo pulses in the overlying scalp and skull. In its journey from the scalp to the brain through the skull, this leading pulse loses half of its initial energy to boundary reflections alone - energy from which the echoes proliferate. This process also affects pulses that travel across the brain and reflect back, as we have identified as many as 18 echoes in those signals. The echo patterns exhibited in these waveforms are linked to a number of distinct propagation paths through the scalp, skull, and brain. When these individual pulses arrive back at the transducer, they often overlap and can reinforce (i.e., interfere constructively) or cancel out (i.e., interfere destructively) one another. To aid in interpreting these complex signals, we have constructed a multilayered computer model of the head. Using the model, we construct echo waveforms that account for more than forty distinct propagation paths. Comparing the model-predicted waveforms with the acquired signals, we can identify the individual routes through the head that are most important in forming the acquired transcranial ultrasound. The individual ultrasound pulses themselves carry the imprint of the physical properties of tissues through which they travel. By associating each pulse with its unique path, we gain a solid understanding of the tissue-specific information content of each component of the acquired transcranial waveform. This knowledge provides us with a number of options in devising a measurement strategy for the brain tissue.
Dissecting the waveform
The general structure of a transcranial ultrasonic waveform is illustrated in Figure 1. An ultrasonic pulse is launched into the head by the transducer in the region above the ear, and the echoes are captured by the same transducer. The resulting waveform has three distinctive regions - the near field, the interior zone, and the far field. The far field region is the focus of our analysis in this paper and consists of echoes from the family of pulses that have propagated across the brain and back. These include pulses that reverberate in the scalp and skull layers on both sides of the head. Using advanced data analysis tools (e.g., Fourier analysis, wavelet methods), it is possible to extract the ultrasonic transmission properties of the brain itself from these waveforms by isolating and comparing the right combination of echoes. Identifying which of these pulses are suitable for such a purpose is the primary job of our model.
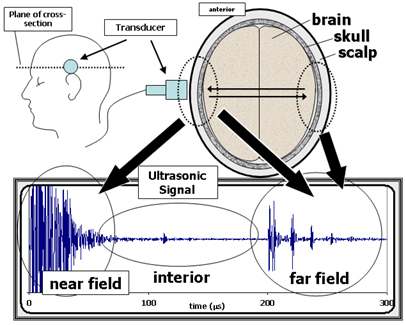
Figure 1. General features of a transcranial ultrasonic signal.
The top right diagram is a cross-section of the head (horizontal slice
just above the ear) in terms of its three primary tissue layers the brain,
skull, and scalp. The top left diagram shows a side view of the head, indicating
the position of the transducer and the plane of the cross-section shown on
the right. The transducer launches an ultrasonic pulse into the head and then
receives back the echoes from inside the head. The resulting waveform, shown
in the bottom graph, consists of three regions. The near field is due to the
echoes from the layers close to the transducer. (The near field signals are
not well resolved due to saturation as these measurements were optimized to
capture the smaller interior and far field signals.) The interior region is
composed of echoes and scattering from inside the brain (e.g., ventricle
and mid-line echoes, parenchymal scattering). The far field consists of signals
that have traveled across the brain and back. The structure in the far field
is due to reverberations of echo pulses in the scalp and skull on both sides
of the head.
The computational head model consists of seven layers including five for the head itself and two boundary layers. The layout is shown in Figure 2. The five layers of the head are made up of three tissue types representing the scalp, skull, and brain. Each tissue type is defined by three physical properties (speed of sound, attenuation, and density), and each layer of the model is in turn defined by its tissue type and thickness. (Thicknesses are estimated from x-ray CT images of the subject if available.) Despite its simplistic three-tissue composition, we have found the model to provide a consistent interpretation of the transcranial signals across our study population. Figure 3 is a schematic diagram of the nine propagation paths that are the most important contributors to the far-field signals. To generate the model-predicted waveform, a pulse is computed for each path, and then all of the pulses are added together.
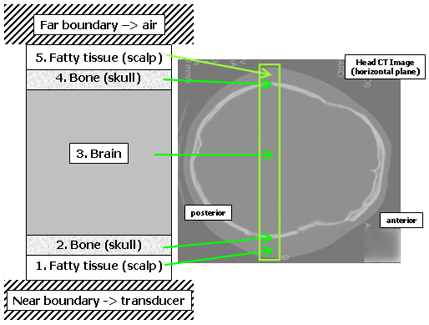
Figure 2. The multilayer transcranial propagation model.
This figure shows the five interior layers and two boundary layers that make up the one-dimensional model for predicting transcranial ultrasonic waveforms. The model represents a section through the head joining the regions just above the ear. The x-ray CT image at right shows the corresponding anatomical region. Each layer is made up of a single tissue type that is decribed by a single set of physical properties. The model has enough detail to provide a solid interpretation of the actual signals, even though the real tissues are much more complex. (As an example of the true complexity, consider the scalp - the term scalp is actually an acronym for the five tissue layers that comprise it.)
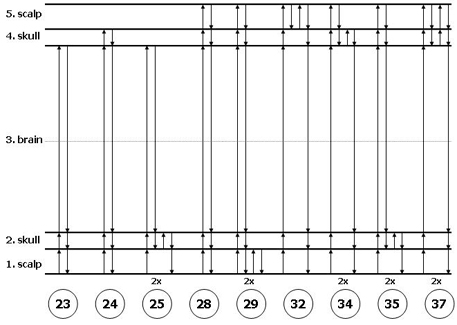
Figure 3. Propagation diagrams.
These diagrams represent the paths that a pulse can take through the layers of the head model. The paths start and end at the bottom boundary where the transducer is located. The paths shown here are the nine that are the most important to the model in building the far-field signal. The solid arrows represent the one-dimensional ultrasonic propagation paths across the five internal layers. (The path numbers are only labels and have no physical significance.) For example, in path 25, a signal propagates directly across the scalp, skull and brain (layers 1,2 and 3), and reflects from the brain/skull interface on the far side. It then propagates back across the brain and into the near side skull, reverberates once in the skull and then returns to the source plane. The 2x label means that there is second distinct path that, as far as the model is concerned, is indistinguishable from the one shown. (Note that the paths all lie along a single straight line the horizontal offsets shown in these diagrams do not represent any actual lateral shifting of the pulses as they move through the head.)
A comparison of patient-acquired and model-predicted waveforms, along with a breakdown of the model in terms of the individual pulses, is shown in Figure 4. The acquired and predicted waveforms have many features in common, especially in the first two signal groups. The initial peak in the first group is due to path 23 (see Figure 3), whose single reflection occurs at the brain/skull interface on the far side. The second peak in the initial group is from the partially constructive interference of pulses 24 and 25. These two pulses both make an extra round trip through the skull, one in the near side layer (path 25), and the other in the far side layer (path 24). The second group is anchored by the pulse from path 28, which has a single reflection off of the far scalp/air boundary. As with the earlier case, the trailing portion of this second group is due to interfering reverberations in the near and far skull layers (paths 34 and 35). In this second group, however, the two pulses interfere destructively and the second peak is greatly suppressed. Throughout our study data, the six pulses mentioned above are the strongest contributors to the first two signal groups. These six pulses are also of most interest to us in the development of our measurement strategy. Paths of higher-order reverberations also make detectable contributions, although the temporal accuracy of the model predictions begins to break down as we move beyond the first two signal groups. This breakdown is due to both the complex nature of the real tissues and the deviations from parallel of the various surfaces.
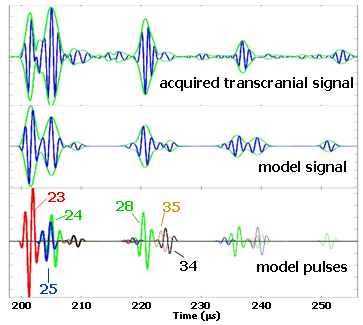
Figure 4. Comparison of the model and data in the far-field.
The top waveform is a transcranially-acquired signal from one of the subjects in our study population. The green envelope around the waveform (analytic signal magnitude) is an aid to help distinguish the various signal components. The middle waveform is the model prediction, where the layer thicknesses were derived from x-ray CT images of the subject. The bottom row displays the individual pulses that are summed together to construct the model waveform. The first group referred to in the text is the part of these signals that occurs before 210 microseconds and has two similarly sized-peaks. The second group starts at 218 microseconds, and the third group starts around 235 microseconds.
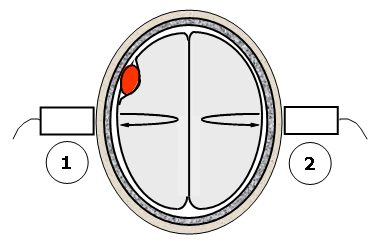
Figure 5. The differential backscatter approach to lesion detection.
This figure illustrates a potential measurement technique for detecting space-filling lesions. The method takes advantage of the approximate mirror symmetry of the hemispheres in a normal brain. A measurement of the scattering properties of the brain tissue is made on one side of the head using the scattering and echo signals acquired transcranially (step 1). The same measurement is repeated on the other side of the head (step 2). Significant differences in the two measurements can indicate the presence of a space-filling lesion that is breaking the left-right symmetry of the brain.
Present and future
From our existing data, we have been able to establish the physical content of the transcranial echo signals. Great challenges remain in using that knowledge to establish a repeatable measurement scheme and in applying the scheme in a manner that is sensitive to pathological conditions inside the cranium. Figure 5 describes one measurement strategy using differential normalized backscatter to detect the breaking of left-right symmetry in the brain due to the presence of a space-filling lesion. We are currently planning our next round of clinical studies which will feature upgraded acquisition hardware and an expanded array of measurements. Someday soon, echoes in the head may provide a critical early indicator of traumatic brain injury, putting the trauma victim on a path towards the best possible outcome.[This work was sponsored by the U.S. Army Medical Research and Materiel Command, with further support from ORNL SEED funding, and the U.S. Dept. of Energy.]