ASA/CAA '05 Meeting, Vancouver, BC


Using Sound Images to Count Salmon in the Fraser River
John A. Holmes - holmesj@pac.dfo-mpo.gc.caGeorge Cronkite
Hermann J. Enzenhofer
Fisheries and Oceans Canada
Pacific Biological Station
3190 Hammond Bay Road
Nanaimo, B.C., Canada
V9T 6N7
Popular version of paper 1aAO6
Presented Monday morning, May 16, 2005
149th ASA Meeting, Vancouver, BC
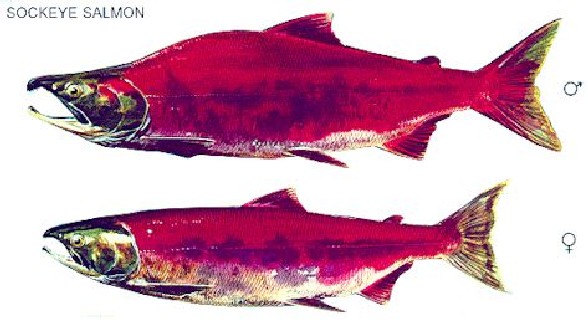
Why would a fish biologist use an imaging sonar system to count fish? The Fraser River in British Columbia, Canada, is home to the largest grouping of Pacific salmon stocks in the world, over 150 stocks at last count. All five Pacific salmon species are found in the Fraser River pink, coho, chum, Chinook, and sockeye and these species have enormous economic, social and cultural importance to Canadians, Americans, and First Nations on the west coast of North America. The most highly prized species sockeye salmon (Fig. 1) is the focus of intense management under the Pacific Salmon Treaty, which was signed and ratified by the federal governments of Canada and the United States in 1985. Fisheries managers first allocate a portion of returning sockeye salmon to meet annual escapement goals (the number of fish returning to their home stream to spawn to sustain each stock) and then the remaining fish are allocated to harvesting by First Nations, commercial and recreational fisheries. Reliable escapement data is a key requirement for effective management of sockeye salmon. Historically, the escapement of sockeye salmon stocks for which pre-season forecasts predict more than 25,000 fish will be returning is measured using a mark-recapture program (MRP). These programs involve capturing and marking returning salmon below their spawning grounds and then constant monitoring of the spawning grounds to determine the ratio of marked to unmarked fish. Knowing the ratio of marked to unmarked fish recaptured and the total number of fish that were marked downstream, the number of fish that return can be estimated. As a result of stock-rebuilding efforts that were initiated in 1987, the number of stocks exceeding the 25,000 fish criterion (changed to 75,000 fish in 2004) has increased, placing considerable pressure on the resources available for assessing sockeye salmon stocks in the Fraser River. A mark-recapture estimate requires a large field crew and since sockeye salmon begin returning to their streams in July and may not finish spawning until late November or early December, these programs are both labour-intensive and costly to operate.
head and red body.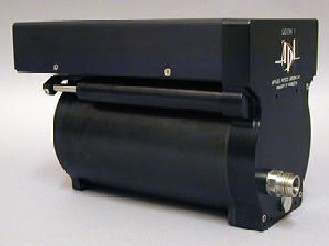
Figure 2. The DIDSON acoustic imaging system underwater hardware. The rectangular box on top houses the transducer array (which emits and recieves sound) and a movable lens system that focuses the sound beams.
What are we doing? We are investigating the dual-frequency identification sonar (DIDSON) technology (underwater transducer shown at left) as alternative method for counting fish in sockeye salmon stocks that are assessed with mark-recapture programs, i.e., large returning stocks. Sonar is a non-invasive, non-destructive technique for monitoring the abundance of fish populations and this is an important advantage given the high esteem for sockeye salmon in British Columbia. Conventional sonar has been used to estimate gross escapement of all sockeye salmon stocks into the Fraser River since 1977 at Mission, but it has not been used to estimate stock-specific escapement in natal streams because of the perception that the training required to operate these systems and analyze the data is high and consequently, suitable sites have not been identified. The DIDSON imaging system is the newest generation of sonar technology and it uses sound and a lens system to produce near video-quality images of fish at ranges up to 15 m in its high frequency mode (1.8 MHz) and up to 40 m in its low-frequency mode (1.1 MHz). The system is small, highly portable and does not require extensive sonar expertise to set up and operate and because it is visual, interpretation of the fish images is intuitive and does not require specialized training in acoustics. Users can readily see and understand the behaviour of migrating fish with this system (Fig. 3 - fish at 2.5 m in bubbles and turbulence). Can the DIDSON system be used to count sockeye salmon in the Fraser River watershed? The reliable detection and enumeration of fish passage in riverine environments with acoustic systems involves the recognition and solving of problems derived from three sources: (1) site characteristics such as the bottom profile and water flow pattern; (2) the operating characteristics of the acoustic system; and (3) fish behaviour. Based on a combination of in-stream testing and site visits in 2004, we found that the physical characteristics and fish behaviour at 9 sites on 6 rivers in the Fraser River watershed permitted effective use of the DIDSON system for counting sockeye salmon. Sites on three other rivers were not suitable either because there was a high probability of unusual fish behaviour such as milling (back and forth movement past a site by the same individual) or holding (little upstream or downstream movement over time) or because site characteristics were so poor they could not be overcome through modifications. Successful enumeration of migrating salmon with a DIDSON system depends on the fish migrating within 15-40 m of the banks of a river. Some of the sites that we identified will require the installation of small weirs in the river to constrict the migration range of fish to the water sampled by the imaging sonar. We also found during our testing that the detection of fish with the DIDSON system is more tolerant than conventional sonar systems of background noise from bubbles and turbulence in the water and interference from the surface and bottom (Fig. 3). Figure 3. Sockeye salmon image at 2.5 m recorded by the DIDSON system. This fish was detected despite extensive bubbles and turbulence (light blue in the figure). Click on the image to play a short movie.
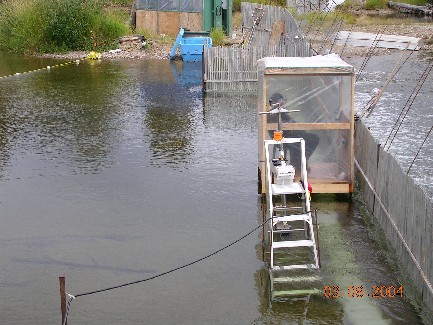
Figure 4. Experimental setup at the Stellako River fish fence to assess the accuracy and precision of fish counts from the DIDSON imaging system. The DIDSON system is mounted on the stepladder, facing the shed. The gate used to pass salmon through the fence is on the opposite side of the shed.How reliable are the data generated by the DIDSON system in terms of their accuracy (closeness to the true value) and precision (repeatability within or among observers)? We looked at the accuracy of our data by comparing fish counts produced by the DIDSON system (mounted on the stepladder in the picture below) to simultaneous counts of fish passing through an enumeration fence. An enumeration fence consists of a series of panels that block the upstream movement of migrating salmon (Fig. 4, left. Structure running diagonally on the right side of the picture). When a large number of salmon are observed waiting on the downstream side of the fence, a gate is opened to allow these fish to continue upstream to their spawning grounds and as they pass through the gate these fish are counted by an observer (in the shed in Fig. 4). Once installed, an enumeration fence provides a complete census of the spawning population and is considered the most accurate method for estimating salmon escapement in clear waters in British Columbia. When we plotted our DIDSON counts and fence counts, which represent two measures of the same phenomenon, and fitted a line to these data, we found that the line was statistically indistinguishable from a 45° line passing through the origin of the plot (i.e., a 1:1 line). This line means that both methods agree, at least up to counts of 932 fish for a single gate opening, the highest count that we achieved during our testing. We hoped to obtain much higher counts and higher fish densities during our counting expedition, but sockeye salmon spawning ground returns were poorer than expected in 2004 so the high densities of migrating fish that typify large populations were not observed. When we compared independent counts of the same file by different observers, we found that these counts varied, on average, by less than 2% when the number of fish counted exceeded 50, which is consistent with high precision.
What does all of this mean? We identified six river systems in the Fraser River on which the DIDSON imaging system can be effectively used to count returning adult salmon. All six rivers (Chilko, Horsefly, Mitchell, Scotch, Seymour and the lower Adams River) support large and important sockeye salmon stocks. If the DIDSON system is carefully aimed so that it samples the volume of water through which salmon are migrating at the sites we have identified, then the resulting count data should be as accurate as counts from an fish enumeration fence and it will not matter which observer makes the count, since there is little disagreement between observers. On the Chilko and lower Adams River two DIDSON systems will be needed to effectively count all returning sockeye salmon; on the other rivers only one system is required. Both the questions that we addressed in 2004 and our answers focus on sockeye salmon stocks that are typically evaluated using mark-recapture programs because of the potential cost-savings that could be achieved if the technology proves to be useful and is implemented operationally into salmon assessment programs. Using the DIDSON system to estimate the escapement of some of the major sockeye salmon stocks in the Fraser River is likely to improve data quality in terms of its accuracy and precision and this improvement may be achieved at lower cost to existing stock assessment programs because the labour and operating costs of a DIDSON system are lower than similar costs for a mark-recapture study on the same stock.
What's next? First, we plan to use the DIDSON system to enumerate returning salmon on the Horsefly River in 2005 (Fig. 5). Pre-season forecasts are currently predicting that up to 3 million sockeye salmon may return to this river and pass through a site where the river is 25 m wide (Fig. 5) over a two month period. These returning sockeye salmon should be an important test of the DIDSON technology because we expect to see very high densities of fish throughout this period. Second, the DIDSON system cannot measure biological variables of fish such as sex and maturity, but we can get size and shape information and perhaps behavioural information and we are developing software that will use these data to automate the process of species identification and counting.
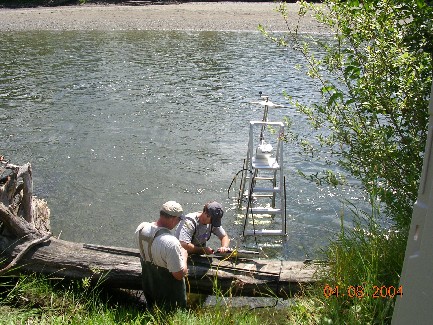
Figure 5. Site on the Horsefly River at which the DIDSON imaging system can effectively count returning sockeye salmon. The DIDSON system is mounted on the stepladder, about 3 m off the left bank. The river is about 27 m wide when this photo was taken in August 2004 and water flow is from right to left. This site is about 800 m above the mouth and below all known sockeye salmon spawning areas in the Horsefly River.
This work was supported by a grant from the Southern Boundary Restoration and Enhancement Fund of the Pacific Salmon Commission.