ASA/CAA '05 Meeting, Vancouver, BC


Sound Propagation in a Street
Judicaël Picaut - Judicael.Picaut@lcpc.fr
Laboratoire Central des Ponts et Chaussées
Section Acoustique Routière et Urbaine
Route de Bouaye - BP 4129
44341 Bouguenais Cedex - France
Popular version of paper 2aNS1
Presented Tuesday morning, May 17, 2005
149th ASA Meeting, Vancouver, BC
1. Introduction
Urban noise is an important problem for people living in cities. For this reason, and in order to investigate the behavior of sound in urban areas, many investigations have been carried out on the theoretical modeling of sound propagation in streets; some works considering, for example, specular reflection on building façades, others taking into account diffuse reflection by irregularities and protrusions on building surfaces. The main problem is the insufficiency of comparisons with real data of sound propagation in streets. More generally, the lack of experimental results is a major problem for the validation of the models and the study of the sound propagation in urban areas. This is mainly due to the complexity of the realization of such experiments in urban areas and particularly for practical reasons: the streets must be closed to traffic; legal authorizations are required; meteorological effects cannot be controlled, etc. Moreover, from an acoustic point of view, large pieces of equipment are required to obtain a full description of the sound field in a street, like a sound map. For this reason, scale model experiments have also been developed to study the noise propagation in urban environment, but, due to the complexity of such measurements, most of experimental data are still difficult to be investigated. The aim of this study is then, first, to give experimental data to the scientific community, and secondly, to present an experimental study of the sound propagation in a street [1].
2. Experiments
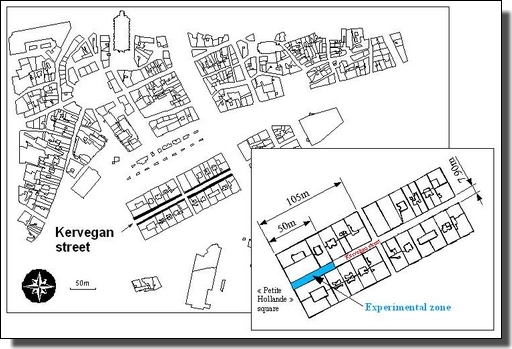
Measurements were carried out in the first 50m of Kervegan street in downtown Nantes, in France (figure 1). This is a pedestrian street of 210m long, constant height (approximately 18m) and width (7.90m) and, with only one junction. The west end is opened to a large square ("Petite Hollande" square) without building, and characterized by a very slight traffic flow. This extremity can be easily considered as opened on a free field. The east end (55m beyond the experimental zone) is crossed by a perpendicular street (Duguesclin street) of 6.58m width, without traffic. The morphology of the building façades is uniform all along the street, and may be defined as a periodic arrangement of windows. The façades are mainly constituted by stone, glass and woodworks. The sound absorption by building façades, as well as the diffusion, may be supposed to be uniform in the street. The pavement is constituted by cobblestones and can be considered as a perfectly reflecting surface.
|
Figure 1. Location of the Kervegan street in downtown
Nantes (France).
|
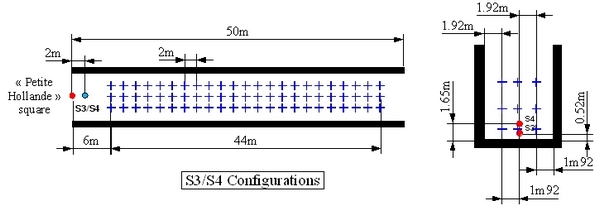
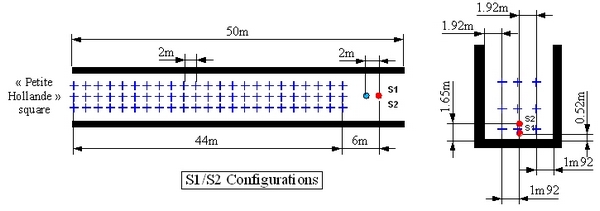
Four measurement configurations were considered, each one corresponding to a specific position of the sound source (figure 2). These configurations (S1 to S4) are defined by two source heights (0.52m and 1.65m) and two locations of the sound source (at the beginning of the street for the S3/S4 configurations, and in the middle of the street for the S1/S2 configurations). For each configuration, a reference microphone M1 was located 2m from the sound source. It was used also to activate the data acquisition. The array of microphones M2 to M10 was moved from 6m to 50m to the sound source, step by step every 2m.
 |
|
Figure 2. Measurement configurations in the Kervegan
street. The acoustics sources (l)
were disposed in the middle of the street, at 0.52m (S1/S3) or at 1.65m
(S2/S4) above the pavement. The location of the microphones are given
by the + markers (M2 to M10 microphones)
and the l
marker (M1, reference microphone).
|
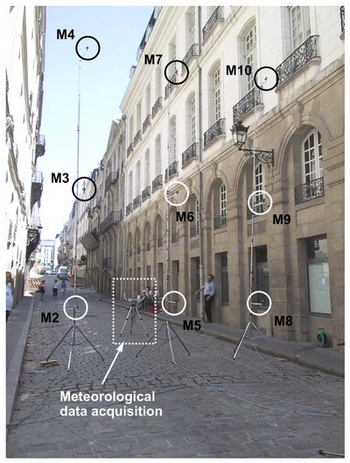
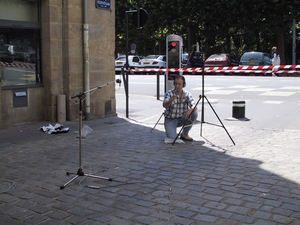
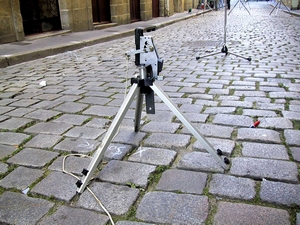
Acoustic measurements were performed with AVM MI17 ICP microphones, Bruël and Kjær microphones type 4135 and 4165, and GRAS microphones type 40AF, fixed on Bruël and Kjær preamplifier type 2619 and 2639. The array of microphones (figure 3a) was constituted of three masts, each one with three microphones at 1.20, 3.30 and 6.0 m height. The sound source (a pistol) was fixed to a support to keep constant the height 1.65 (figure 3b) or 0.52 m (figure 3c) and was activated by an operator. Measurements were recording on an integrated digital recorder TEAC GX-1 with AR-GXMC and AR-GXPA input amp cards, connected to a PC notebook. The sample frequency and the recording time were respectively 20480Hz and 3s. A 10kHz low pass filter was applied on each acquisition channel. A meteorological data acquisition system was also disposed in the street for the measurement of the temperature, pressure, humidity and wind speed.
|
(a) Array of microphones (M2 to M10) and meteorological data acquisition system. |
(b) Sound source (1.65m above the pavement) and reference microphone (M1). |
|
(c) Sound source (0.52m above the pavement). |
|
|
Figure 3. View of the experimental system.
|
|
|
See a small video of the
experiment (16Mo, 85 seconds, in French)
- This is a part of a French local TV news channel (France 3 Pays de La Loire, July, 2002) - |
|
To avoid the small fluctuations of the sound source between consecutive activating, 5 measurements (i.e. 5 pistol shots) were recorded for each sound source position and each location of the microphones array. In summary, each configuration is defined by 23 measurements sections, 9 microphones per section in addition to the reference microphone, and 5 pistol shots by section. In total, 23 sections x (9 + 1) microphones x 5 pistol shots = 1150 impulse responses (RI) are then obtained for each configuration. That means, for instance, 1150 x 4 configurations = 4600 data files for the whole experiment. A special RI processing was developed in order to calculate the sound level (SPL) and the reverberation times (RT30), for each position in the street, and for each 1/3 octave band between 250Hz and 5000Hz. In total, more than 11 592 useful data have been collected during this experiment, and are available by contacting the author.
3. Results
Moreover, by analyzing and comparing the results in terms of RT and sound levels, many interesting conclusions have been obtained, particularly:
- The sound field uniformity in a cross-section of the street: sound levels and RTs are quite uniform in a street section, even for a section very close to the sound source. An accurate study of the sound field in a same section has also shown that the sound level deviation decreases when the distance from source increases, while the RT deviation is constant. It suggests that the sound field very close to the source is slightly dependent of the behavior of the early reflections. However, this deviation is very small, less than 1dB for the sound level and 0.036s for the RT.
- The increase of RT with the increase of source–receiver distance over the frequency range between 250 and 5000Hz. Moreover, the sound decay is smaller at low frequency than at high frequency. It can be explained by the "diffuse behavior" of the building façades, which favors high frequency reflection in all directions, increasing sky absorption, while low frequencies are more channeled in the street.
- No frequency effect on the sound attenuation in the street. Whatever the experimental configuration and the frequency range, the shape of the relative sound level attenuation in the street seems to be only dependent on the street width and height.
- No effect of the source height: if existing, such effects should appears for a larger source height.
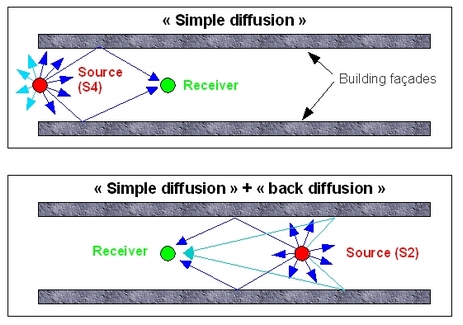
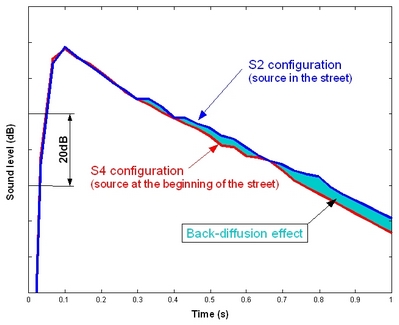
- The back-diffusion effect on the reverberation in the street: When the source is at the beginning of the street (S3/S4 configurations), a large part of the initial sound field is lost through the open end (figure 4a). The sound field in the street is then only supplied by the part of the sound energy which is radiated inside the street. On the other hand, when the source is located inside the street (S1/S2 configurations), the part of the initial sound energy which is radiated by the source in the opposite direction to the receivers, can be reflected towards the receiver (back-diffusion), according to the shape and the disposition of the building irregularities, increasing the reverberation (figure 4b).
|
(a) Schematic representation of the back-diffusion effect. In the upper illustration (source at the beginning of the street), the sound field propagating outside the street can not participate to the diffuse sound field inside the street. In the lower illustration (sound source in the street), the sound field propagating to the right of the street can potentially supply the sound field on the left-part of the street (back-diffusion). |
|
|
Figure 4. Illustration of the back-diffusion effect.
|
|
References:
[1] "Experimental study of sound propagation in a street", J.
Picaut, T. Le Pollès, P. L'Hermite, V. Gary, Applied Acoustics 66,
pp. 149-173 (2005).