
Miguel A. Horta - mah471@psu.edu
Steven L. Garrett - sxg185@psu.edu
Penn State Graduate Program in Acoustics
P.O. Box 30 State College, PA 16804
Popular version of paper 3aEA9
Presented Wednesday Morning, Oct. 19, 2005
ASA/NOISE-CON 2005 Meeting, Minneapolis, MN
Maybe you have had the chance to inhale a balloon full of helium and listen to a high-pitched version of your own voice. Just in case you have wonder why this happens, it is because the sound coming from your helium-filled vocal tract is now traveling three times as fast as it usually does. Think of it as a tape playing faster than its usual speed. Either way, this phenomenon inevitably reminds you of the songs of good old Chipmunk’s records. The relationship of the speed-of-sound to the gas composition makes it possible to determine the concentration of a gas in a mixture by listening to the sound produced in it.
Sonic gas analysis does exactly that. By listening to the variations in frequency, or pitch, of a sound in a gas mixture, we can very precisely and quickly measure the changes of concentration of a particular gas in air, or any other combination of gases.
The main objective of this research project is to apply sonic gas analysis to the study and real-time monitoring of bacteria metabolic rates. The results of this project would be of particular interest to researchers working on the development of alternative renewable energy sources, such as the conversion of organic matter in wastewaters into fuels (namely, hydrogen and methane). Furthermore, besides our proposed application to microbiology, this type of gas analysis offers another way to detect different toxic or flammable gases in air and prevent accidents due to gas leaks in many locations like mines or sewers.
Sonic gas analysis principles were originally used in German mines near the end of the nineteenth century. Back then, an analyzer used two whistles mounted next to one another. Gas from the mine was vented through the first whistle. The composition of the mine gas determined the pitch, or frequency, of the sound emitted by this whistle. A second whistle, mounted next to the first, was provided with a stream of clean air from outside the mine. As long as air was the only gas in the mine, the whistles made a sound of the same pitch. If methane or hydrogen were present in the mine, the frequency of the first whistle would increase since both gases have a lower molecular weight than air. The interaction of the sounds made by the two whistles created a warbling in the loudness of the sound, known as beats. These beats warned the miners that there was a possibility of a mine explosion so they could take appropriate action to prevent a disaster.
The emergence of electrical measurement technology in the first half of the 1900’s soon replaced frequency with voltage as the main indicator of gas composition. The primary method to analyze gas concentration was based on thermal conductivity measurements, which use a pair of hot wires (one being a “reference” wire and the other exposed to the gas under test) and an electrical circuit known as a Wheatstone bridge. In such a circuit, a change in voltage output indicates a change in the composition of the gas mixture. Back then, the precision of voltage or current measurements was more precise and less expensive than frequency measurements. In addition, the speakers and microphones required for acoustic gas analyzers were more expensive than the heated wires used in a thermal conductivity gas analyzer.
Nowadays, this tendency has been completely reversed. The precision-to-cost ratio of frequency measurements is much higher than that of voltage or current measurements. To prove it, look at the specifications of your digital watch: it won’t be delayed more than a few minutes in a full year. That means, for a watch with an accuracy of 30 seconds per month, an error of approximately ten parts per million, or 0.001%; all that precision for just a few dollars. The same happens with modern frequency measurements: high precision and low price. On the other hand, a voltmeter of the same accuracy would cost nearly $1000. Furthermore, the cost of speakers, microphones, and commercial-off-the-shelf electronic components has decreased considerably. This reversal in market forces has renewed the interest in sonic gas analysis.
Sonic gas analysis is based on a simple rule: the speed of sound depends on the properties of the gas through which it travels. Properties such as temperature, ratio of specific heats, and molecular weight of a gas mixture determine how fast sound travels through it. If there is a change in the molecular weight of the mixture, the sound speed will be affected proportionally. This relationship between these two quantities is what allows us to measure the changes of a gas concentration by measuring the speed of sound.
However, we do not count how many seconds it takes for sound to travel from one point to another to obtain its speed. A far better way of measuring sound speed is by means of an acoustic resonator. A resonator is an apparatus that is designed to boost the amplitude of sound at one or more selected frequencies. A good example of an acoustic resonator is a half-empty (or half-full, your choice) bottle of water. When you blow over the mouth of the bottle, you will hear a musical note of a single pitch. The frequency of that note is the resonance frequency of the bottle. It turns out that the resonance frequency is directly associated to the speed of sound, which in turn is related the concentration of a gas in the mixture. If the composition of the gas inside the bottle changed, the pitch of the sound would change too, just the way helium gives you a Chipmunk voice.
That is exactly how an acoustic gas analyzer works. In our experiments, a speaker
drives the analyzer at its resonance frequency while the sound output is captured
by a pair of microphones. The signal from the microphones is then fed to an
electronic tracking system which adjusts the driving frequency to keep it always
at resonance. If, for example, the concentration of a contaminant gas in air
changes, it will have an effect on the sound speed and consequently the resonance
frequency of the gas analyzer. Since the tracking system is designed to always
drive the analyzer at resonance, the variation in frequency tells us what the
change in gas concentration was.
In principle, a sonic gas analyzer can be used for the same applications as a thermal conductivity gas analyzer. The most important difference, and an advantage, is its transparency to the medium. While thermal conductivity gas analyzers force a temperature gradient in the medium, sonic gas analyzers only create sound in it, which does not affect the equilibrium state of the system. For an application such as metabolic rate studies of anaerobic bacteria, maintaining properties, such as temperature, unaltered by external devices is crucial to obtaining detailed information about the system.
Plus, a sonic gas analyzer is inexpensive, self-calibrating, reliable even under extreme conditions, insensitive to changes in atmospheric pressure, and easy to operate. Our particular design also rejects noise from other sources. It can be very small and requires very little electrical power. These features make this type of gas analyzers an attractive alternative for applications where thermal conductivity gas analysis cannot be used, for example: personal portable gas sensors for miners, hydrogen detectors in battery compartments of boats and electric cars, or as methane detectors in sewers to prevent explosions like those in Guadalajara, Mexico in 1992.
Our specific application is directed to measurement of the amount of hydrogen or methane produced by anaerobic bacterial metabolism. In our experimental apparatus, the bacteria and the organic matter they breakdown are placed inside a bottle with two ports: a gas inlet and outlet (see Figure 1). A fan in a sealed enclosure (pump) circulates the gases through the resonator that contains a speaker, two microphones, and a temperature sensor (see Figure 2). This gas analyzer is designed to run in near real-time, with a very high accuracy, and is capable of automatic temperature compensation. The results obtained with this type of analyzer will provide more detailed information on gas bio-production. From a basic scientific point-of-view, accurate measurements of the rate of biologically produced gases are needed to better understand and model the conversion processes carried out by these microorganisms.
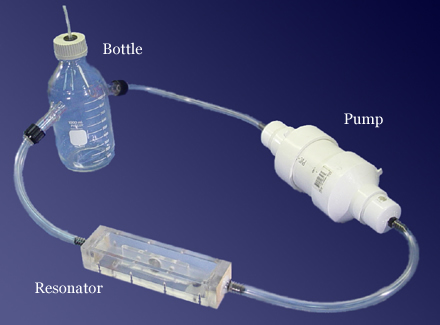
Figure 1. Photograph of the dual resonator connected to the gas pump and glass bottle used as the bioreactor.
Please click on the link below to hear the audio demo of the sonic gas analyzer. In the left channel you will hear Miguel A. Horta explaining the process and in the right channel you will hear the changes in pitch as recorded from the analyzer.
Click here to hear/download the audio clip
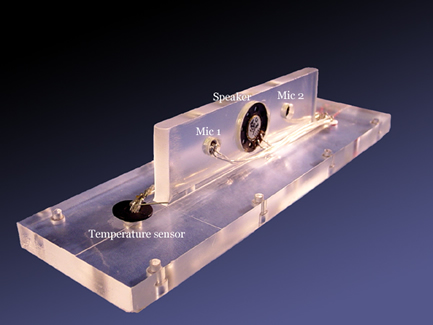
Figure 2. The “lid” of the dual-resonator also contains the transducers used to measure the speed-of-sound in the gas mixture and compensate for changes in the temperature of the mixture. In this view, you can see the back of the small loudspeaker mounted on the barrier that separates the two resonators. That speaker radiates from both its front and back surfaces to excite both resonators with opposite phase. The output signals from the two microphones are subtracted. Since the resonators are driven out-of-phase by the loudspeaker, the microphone signal subtraction doubles the magnitude of the signal of interest while canceling any extraneous noise. The lid also contains a solid-state temperature transducer that sends a current equal to one microampere per degree Kelvin to the signal-processing electronics to compensate for any changes in the temperature of the gas mixture.