[ Lay Language Paper Index | Press Room ]
Popular version of paper 2pEA3
Presented Wednesday afternoon, November 28, 2006
154th ASA Meeting, New Orleans, LA
Low frequency sound (infrasound is 20 Hz and below) is often used in long range detection measurements because the long wavelengths involved can travel over very large distances. In fact, very low frequencies generated by large events can travel around the earth before dissipating completely. For this reason, pressure sensors that can measure very low frequencies are often used to monitor a wide variety of events such as hurricanes, volcanic eruptions and the occasional nuclear detonation.
A difficulty associated with infrasonic measurements arises from the presence of wind. Wind outdoors (as opposed to in wind tunnels) consists of turbulent structures in a wide range of sizes. These structures register as velocity changes in a given location, and velocity fluctuations generate fluctuations in pressure sensors. These pressure fluctuations are inherent to the wind and will be referred to here as "intrinsic pressures". The problem is made more challenging because when a pressure sensor is placed in the wind, the wind interacts with it, causing extra velocity fluctuations which are registered as additional pressure fluctuations in the sensor. These are referred to here as "stagnation" pressures. The intrinsic and stagnation pressures combine to form wind noise.
In order to reduce the intrinsic pressure noise measured by a sensor, you must average the pressures over an area much larger than the turbule that is generating the noise. This is difficult at low frequencies since a 1 Hz turbule traveling at 5 m/s would be approximately 5 m in diameter, so reduction of the intrinsic noise at 1 Hz would require a windscreen larger than at least 5 m in diameter. As this isn't usually practical, wind noise reduction in infrasonic measurements is primarily a task of reducing stagnation noise as much as possible.
In many infrasound measurements, the problem is reduced to viewing spectra of pressure measurements and trying to determine which part of the spectra is due to wind, and what part of the spectra is due to acoustic sources. In this paper the apparatus and methodology required to quantify wind noise levels in infrasonic measurements is discussed.
Currently, wind velocity is best measured with an ultrasonic anemometer. These instruments come in a wide range of shapes and sizes and can measure velocity in one, two or three dimensions. Hot wire anemometers can also be used but these are much more delicate, and the 2-D and 3-D models can be very difficult to use correctly. Figure 1 shows a photo of a 2-D ultrasonic anemometer. For measurements near the ground this would be appropriate since the vertical component of velocity near the ground is small compared to the horizontal components. For measurements far from the ground, a three dimensional system should be employed.
|
Fig. 1: A photo of a common 2-D anemometer. (photo from www.gill.co.uk) |
A second consideration is the output rate of the anemometer. Due to the Nyquist theorem, the highest frequency that can be measured by a device is one half of its sampling rate. Therefore if you are interested in frequencies up to 20 Hz, an anemometer that samples at 40 Hz is necessary.
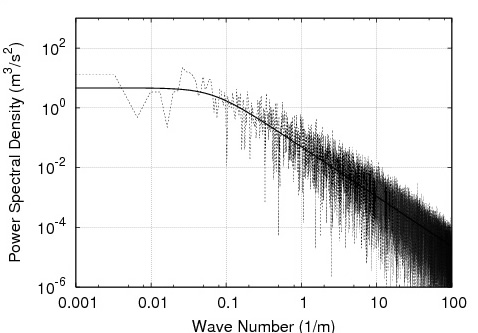 |
Fig. 2: Plot of velocity spectrum as a function of wave number k. k is related to frequency as k=6.28*freq./U where U is the mean wind speed. |
Generally, turbulence is created on large scales by such things as solar radiation, and other atmospheric instabilities and then begins to "fall apart" by decaying into smaller and smaller turbules. As you can see in Figure 2, the source region (low frequency or low wavenumber, in this case below 0.1) is typically flat, while the "inertial range" which is the spectra of the decaying portions of the turbulence falls off as a power law.
Figure 2 shows a wind velocity spectrum for a fifteen minute run sampled at a rate of 100 samples/s. The solid line is a fit to the data of the equation
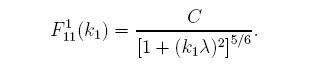
where C and lambda are the fit parameters. The fit parameters are important since they will be used to predict the stagnation and intrinsic pressure levels that would be expected given the wind data.
As mentioned before, stagnation pressures are those generated by placing an object in the wind. As the wind moves around the object, large pressure fluctuations are generated. These fluctuations will have a spectrum which can be estimated with the following equation:
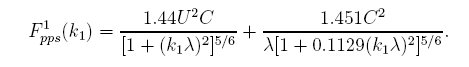
In this expression, the C and lambda are the parameters from the velocity fit above, and U is the mean velocity. Figure 3 shows the results of the stagnation prediction along with data taken with a bare, vertically oriented microphone. They agree very well.
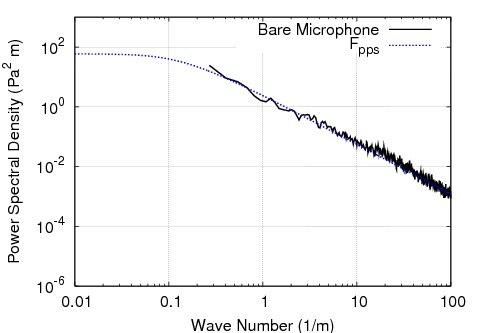 |
Fig. 3: Plot of pressure spectrum measured by an unscreened vertical microphone with the predicted stagnation spectrum |
The vertical orientation of the microphone has been shown to work better than a microphone pointed into the wind. If the microphone is pointed into the wind, then the pressures measured will be larger than those predicted. This is possibly due to interactions of the wind directly with the surface of the microphone. Also, a vertical microphone is not prone to errors in alignment that may occur when wind shifts cause a microphone origionally aimed into the wind to no longer be.
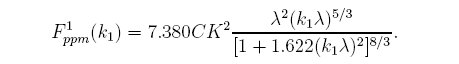
As mentioned above, the intrinsic pressures measured by a microphone in the wind are pressures that are inherent to the wind. In a similar manner as in the stagnation case, we have developed a convienient fit to the turbulence interaction spectrum based on the fit values from the wind velocity spectra:
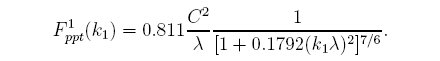
The above equation works if you are measuring pressures far from the ground. Things are made a bit more complicated when measuring near the earth surface as the incident turbulence interacts with the shear layer. When this happens, an additional term arises with the form:
Therefore if you are doing measurements near the ground, the intrinsic pressures are the sum of the previous two equations, while in measurements from high up the first equation is sufficient. The K in the mean shear equation is what is called the "wind velocity profile". Near the ground this can be estimated as
or, better, by measuring the profile with a series of one dimensional anemometers mounted at different heights.
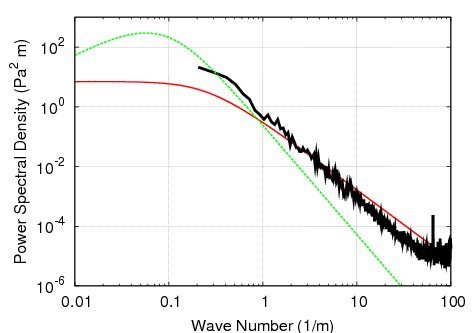 |
Fig. 4: Plot of pressure spectrum measured by a microphone in a 1 m thick windscreen approximately 1 m above the ground along with plots of the two equations that make up the intrinsic predictions: red - turbulence, green - turbulence/shear. |
The data in figure 4 was taken in the center of a 1 m diameter spherical windscreen (shown in figure 6) constructed from fiberglass insulation. With the large windscreen we are able to average out the stagnation pressures caused by the interaction of the windscreen with the wind and are left with the intrinsic pressures. Agreement is good below 10 m-1, which is what we expect. At wavenumbers greater than 10, we see that the pressures measured by the screened microphones are lower than predicted by the intrinsic equations. This is because in this range, the incident turbule sizes are small compared to the size of the windscreen, and therefore the pressure fluctuations associated with them can be averaged away.
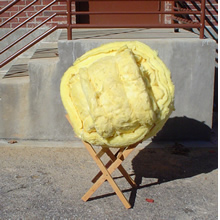 |
Fig. 5: 1 m diameter sphere constructed of fiberglass insulation. |
When measureing infrasonic pressures with a screened sensor, you can expect wind noise to fall within the range of the stagnation to intrinsic pressure levels. With a reasonably sized windscreen you can expect a significant reduction of the stagnation pressure levels that a bare microphone would sense, but reduction of the intrinsic pressure levels would require very large screens, or active noise cancellation.
[ Lay Language Paper Index | Press Room ]