
Cross-correlation of Ship Noise for Water Traffic Monitoring
Laurent Fillinger - lfilling@stevens.edu
Alexander Sutin - asutin@stevens.edu
Alexander Sedunov - asedunov@stevens.edu
Stevens Institute of Technology,
Castle Point on Hudson,
Hoboken, NJ 07060
Popular version of paper 3aUW7
Presented Wednesday Morning, October 28, 2009
158th ASA Meeting, San Antonio, TX
In the wake of the September 11 attacks, the U.S. government has introduced a series of measures to improve port and cargo security. One of the main concerns in port security is connected with vessels smaller than 300 gross tons that do not require AIS (Automatic Identification System). Given the density of commercial and recreational vessel traffic in many, if not most of the nations estuary and harbor environments, the detection, tracking, and classification of small vessels is an important part of port security.
One of the vessel features that can be remotely measured and used for vessel detection and classification is the vessel's acoustic signature. Any moving vessel radiates an underwater sound whose parameters depend on the vessel hull structure, machinery, propeller, etc. Measurements of underwater sound radiated by vessels can provide enough information for vessel identification. Passive acoustic methods are widely applied for ship noise measurements, but their application in busy estuary and harbor environments (see Figure 1) is not simple due to the presence of many vessels and high levels of ambient noise. The problem is that all vessels in the area of interest produce noise at the same time and their individual contributions are difficult to separate. One solution is to use acoustic arrays that enable one to listen in a selected direction, but array systems are large and expensive.
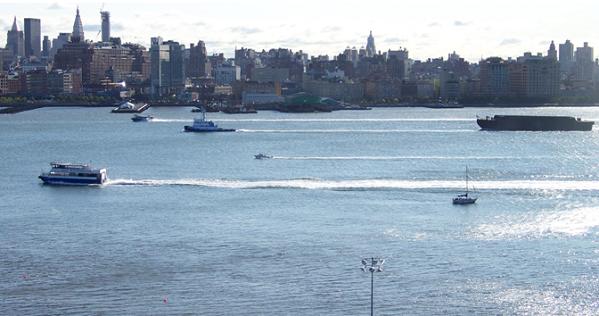
Figure 1. Snapshot of the test site in the Hudson River with many vessels present.
We considered another method that enables such tasks as vessel tracking by extracting individual vessel signatures in busy environments, using a system with a few hydrophones. This method is based on cross-correlation processing of acoustic signals detected by different hydrophones.
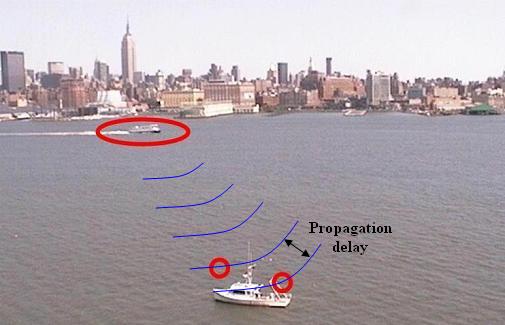
Figure 2. Snapshot of the test site in the Hudson River. A moving ship radiates noise (blue) that propagates and reaches the sensors (red circles) with a delay that depends on the direction to the ship.
The noise radiated by a ship propagates underwater and reaches the hydrophones at different times due to different propagation distances. This delay depends on the direction of the ship. The core of the cross-correlation method is based on the analysis of the time delays in the recorded signals. The analysis of delays is performed using a mathematical tool called cross-correlation. An example of the calculated cross-correlation between two hydrophones for two vessels is shown in Figure 3.
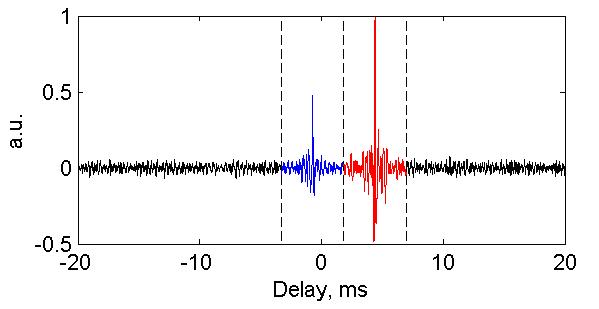
Figure 3. Cross-correlation between two hydrophone signals for two vessels shown in the movie below.
The time variation of the cross-correlation function can be presented in the form of a floating chart similar to a spectrogram. Such graph has two geometric dimensions: the horizontal axis represents time, the vertical axis is the delay between two hydrophone signals; a third dimension, shown in color, indicates the amplitude of a cross-correlation function. The video included with this paper (see Figure 4) shows video recording of the Hudson River water traffic together with cross-correlation floating chart.
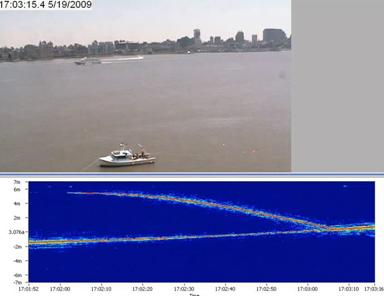
Figure 4. Screenshot and video showing video camera recording along with cross-correlation floating chart.
WATCH a video of Hudson River traffic.
The lines showing cross-correlation peaks can easily be recalculated for the bearing angle (direction) from the hydrophone system to the vessels shown in Figure 5. The cross-correlation function shown in red belongs to the sound produced by the fast boat (Figures 4 and 5), and the cross-correlation function shown in blue belongs to the cruise boat (Figures 4 and 5).
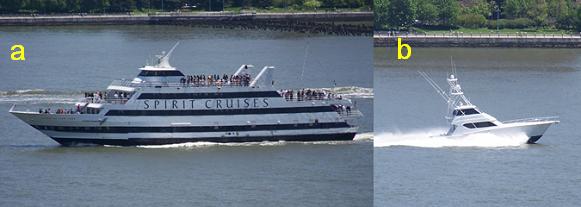
Figure 5. Pictures of two vessels shown in the video.
We used the cross-correlation function for calculating the spectral density of the vessels sound. The spectral density of the received signal is directly related to the spectral density of their cross-correlation. While contributions of different boats cannot be separated in the time domain, they can be separated in delay in the cross-correlation: the spectrum of the contribution of a vessel in the cross-correlation gives an estimation of the spectra of sound radiated from this vessel. Figure 6 shows the power spectral density of the two ships presented in the movie. Such measurements of vessels acoustic signatures can be used for ship identification.
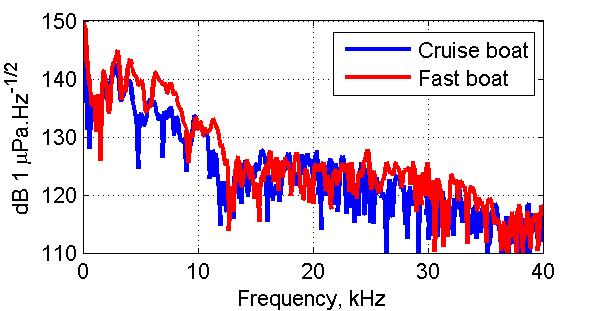
Figure 6. Power spectral density of sound generated by the cruise boat (blue) and by the fast boat (red).
Other important frequency characteristics used for ship classification are connected with mechanical engine and propeller rotational noise. Their frequencies lie below a few hundred hertz. It is very difficult to measure sounds with low frequencies in urban environments because of the high level of low frequency acoustic noise.
Another method of measuring low frequency sound generated by ships is based on the effect of modulation of high frequency ship noise by low frequencies. It was found that the high frequency noise is modulated (i.e. its loudness varies) at a rate dictated by some parameters of the propeller (number of blades, rotational speed). That modulation can be analyzed using the modulation spectrum which is usually conducted by a method called DEMON (Detection of Envelope Modulation on Noise).
The cross-correlation method allows calculation of the vessel noise envelope using cross-correlation computed at a sufficient rate (several hundred of times per second). The envelope of the cross-correlation is proportional to the squared envelope of the vessel radiated signal and its spectral analysis provides an alternative method of calculation of the modulation spectrum. Figure 7 shows the modulation spectrum for two different vessels calculated using the suggested cross-correlation technique. The modulation was measured for ship radiated signal in the frequency band 20-90 kHz.
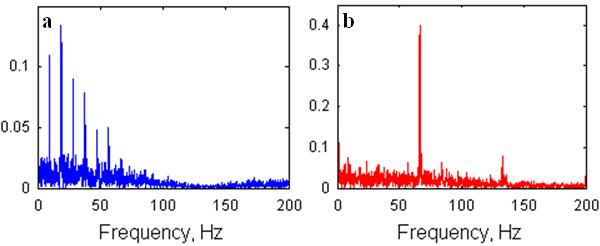
Figure 7. Modulation spectra of vessels shown in Figure 5. a) cruise boat, b) fast boat.
Conclusion. The developed cross-correlation method allows the detection and tracking of vessels in busy estuary and harbor environments. Measurements of the vessels acoustic signatures and modulation spectra can be used for identification.
This work was partially supported by ONR project #N00014-05-1-0632: Navy Force Protection Technology Assessment Project and by the U.S. Department of Homeland Security under Grant Award Number 2008-ST-061-ML0002.
The views and conclusions contained in this document are those of the authors and should not be interpreted as necessarily representing the official policies, either expressed or implied, of the U.S. Department of Homeland Security and the Office of Naval Research.