Timothy Y. Hsu – gth776e@mail.gatech.edu
Erica E. Ryherd – Eric.ryherd@me.gatech.edu
Georgia Institute of Technology
771 Ferst Drive
Atlanta, GA 30332
Jeremy Ackerman - jdacker@emory.edu
Department of Emergency Medicine
Emory University School of Medicine
49 Jesse Hill Jr. Drive, SE
Atlanta, GA 30303-3219
Kerstin Persson
Waye - Kerstin.persson-waye@amm.gu.se
Sahlgrenska Academy
University of Gothernberg, Institute of Medicine
Popular version of paper 1pNS6
Presented Monday morning, November 15, 2010
2nd Pan-American/Iberian Meeting on Acoustics, Cancun, Mexico
This paper presents a follow up study on a larger project initiated in Sweden that looks into the effect of the hospital sound environment on intensive care unit staff and patients. Throughout the last century, there have been many anecdotal reasons to believe that the sounds of the hospital caused concern among the hospital occupants. Preliminary studies emerged suggesting that sound can adversely alter patient physiological functions, such as quality of sleep and cardiologic function. This study aims to 1) characterize the acoustic space; 2) discover if there are statistically significant relationships between noise level and physiological response; and 3) determine which patient populations to focus on future studies.
For this study, we focused solely on the patient population. The sample size consisted of 18 medical-surgical intensive care unit (ICU) patients, and for each patient, both acoustic and physiological measurements were made. The acoustic measurements consisted of a sound level meter that took measurements every minute for 24 hours. The metrics taken were: A-weighted average sound level (LAeq), A-weighted maximum sound level (LAmax), C-weighted peak levels (LCpk), and A-weighted minimum level (LAmin). Physiological measurements consisted of heart rate, respiratory rate, percent oxygen saturation, and blood pressure (systolic, diastolic, and median).
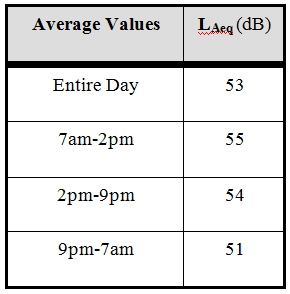
The first question was “How loud is the ICU?” The World Health Organization (WHO) community guidelines state that the average sound pressure level in a patient room should not exceed 35 dB during the day and 30 dB at night. Using the 24-hour sound level measurements, average sound level of the ICU was calculated. Table 1 shows the average sound level as broken down by work shift. One can see that these values exceeded the WHO standards.
Table 1 . Average Sound Levels in the medical surgical ICU
In this study we also have implemented a novel technique called the Occurrence Rate. This occurrence rate graph shows how often the noise in the environment exceeds a certain threshold. We applied this technique to the sound level meter measurements and the results are shown in Figure 1. In this graph, LAeq exceeds 45 dB about 85 % of the time and it exceeds 55dB only about 15% of the time. This graph reveals the distribution of sound levels and gives more insight into what type of sound levels are present in the ICU.
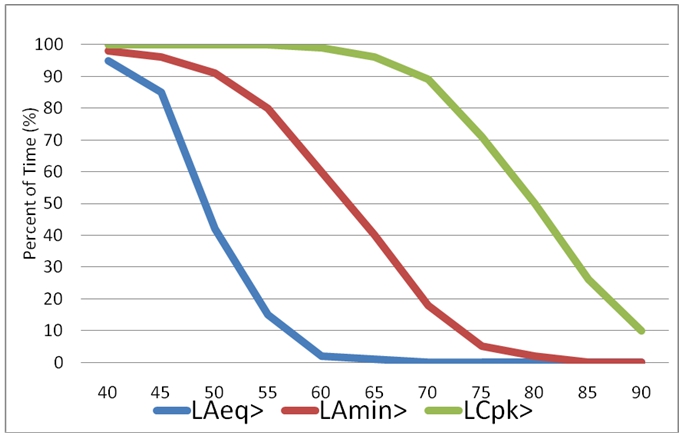
Figure 1 . Occurrence rate throughout all measurements in the ICU
The third goal of this project though is to determine if a relationship exists between physiologic response and acoustics using robust statistical methods. We were able to use the physiologic data and the sound level meter recordings to create a data set for statistical analysis. Table 2 shows that the Pearson correlations were statistically significant (p<0.01) between the physiological data and the sound data. A “+” denotes a significant relationship in the positive direction, and a “-“denotes a significant relationship in a negative direction. A blank square means there is no statistically significant relationship. Thus, average sound level was positively correlated with blood pressure measurements—meaning that as sound pressure increased the blood pressure increased. It is clear from this table that further analysis can be done to clarify this relationship.
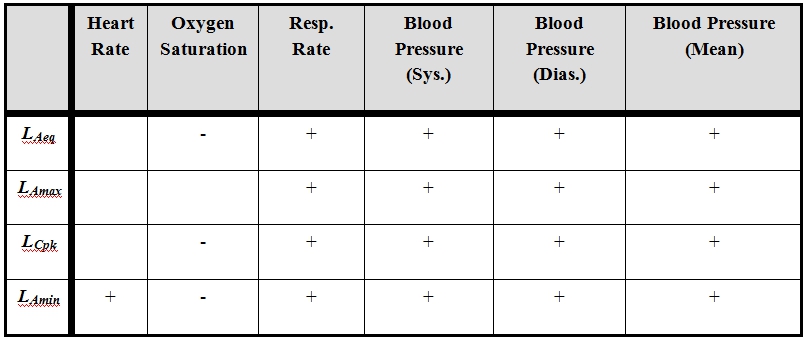
Table 2 . Pearson correlations relationships (p<0.01) between acoustic measurements and physiological measurements. “+” denotes statistically significant positive direction relationship, “-“ denotes statistically significant negative direction relationship, and blanks denote not statistically significant relationships.
In order to shed more light on the relationship, more statistical analysis was needed. Linear regression was utilized to help further clarify this relationship. This analysis determined how much physiological change occurred with a change of 10 dB. To summarize this data, we present some of statistically significant (p<0.05) linear regression results:
Of particular note, physiologic interpretation of these changes is difficult, in part because this is a heterogeneous patient population. Taken as a whole, this data best suggests increased distress as sound levels increase, but this interpretation may not hold universally. Depending on the patient’s underlying condition these changes could be interpreted as being either positive or negative. A change in oxygen saturation of 0.6% is interesting but not likely to result in any significant change in the patient’s management. Changes in heart rate, respiratory rate, and blood pressure of this magnitude could potentially be considered significant and could potentially lead to changes in their management. Elevations in blood pressure might lead to decreasing doses of vassopressors and the addition of anti-hypertensive medications. Significant changes in respiratory rate can be interpreted in a variety of ways depending on the patient’s condition – it could be interpreted negatively as worsening acidosis, pain, psychological distress, under-sedation or infection. Increases of respiratory rate could positively be interpreted as improving alertness or neurologic status.
The last type of analysis performed for this paper was called risk ratio. Risk ratio determines the risk of an outcome due to the exposure of a stimulus. In this case, a specified threshold of noise level was considered the stimulus. Patterns started emerging with statistically significant risks at certain loudness thresholds. Table 3 lists the results of this analysis (p<0.05). For example, in the first row, we can say that there was a 22% increased risk of a higher heart rate when the subject was exposed to an average sound levels greater than 50 dBA LAeq. We can notice that at 50dB LAeq, there wereincreased risks for heart rate, respiratory rate, and blood pressure.
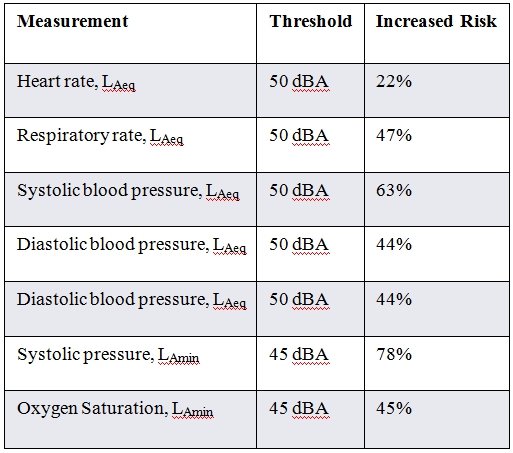
Table 3 . Risk Ratio showing increased risk of heightened physiologic response when exposed to noise levels above certain thresholds.
In summary, this paper has shown that not only are hospitals louder than WHO recommendations, but also that there exists statistically significant relationships between the noise and elevated physiological condition. These increased physiological measurements may potentially have short and long term health effects including increased risk of heightened heart rate and blood pressure. The next step in this research is to determine which areas to focus on and institute more targeted studies to better understand each relationship better.