Acoustic Observations in Support of the Response to
the Deepwater Horizon Oil Spill
Thomas
C. Weber – weber@ccom.unh.edu
Larry
Mayer – larry@ccom.unh.edu
University
of New Hampshire
Durham, NH 03824
Alex De Robertis - Alex.DeRobertis@noaa.gov
Christopher
D. Wilson - chris.wilson@noaa.gov
NOAA-Alaska
Fisheries Science Center
Seattle,
WA 98116
Sam
Greenaway - samuel.greenaway@noaa.gov
Shep Smith - co.thomas.jefferson@noaa.gov
Glen Rice – glen.rice@noaa.gov
NOAA-OCS
Silver
Springs, Maryland 20852
Popular
version of paper 3aUWa2
Presented
Wednesday morning, November 17, 2010
2nd Pan-American/Iberian Meeting on Acoustics, Cancun, Mexico
On
April 20 of 2010 an explosion on the Deepwater Horizon drilling rig killed 11
workers and precipitated an oil spill in which approximately 4.9 million
barrels of crude oil were released from the damaged wellhead. The rig was operating in 1500
meters of water, and this depth confounded our collective ability to readily
observe what was happening to the oil as it exited the well. By mid-May, observations of underwater
oil plumes were reported, and later that month we embarked on the first of many
cruises onboard NOAA research ships with the principal aim to use scientific
echo sounders (i.e. sonars) to map subsurface gas and
oil near the wellhead. Over
the next few months, we used these echo sounders to map the many natural
methane gas seeps in the area, to directly observe the oil in the top few
hundred meters of the water column, to examine some of the local effects of the
oil plume on marine organisms throughout the water column, and finally to
monitor the integrity of the well after it was capped in mid-July.
Each
of these subsurface acoustic mapping cruises used a variant of the Simrad EK60 scientific echo sounders that have been
developed for fisheries research.
These systems provide a quantitative, calibrated output and have a low
noise floor and high dynamic range.
Multiple acoustic frequencies, ranging from 12-200 kHz were used during
the research cruises. No single
frequency would have sufficed: the lower frequencies required to
‘sound’ the full ocean depth are particularly useful at identifying
gas seeps in the water column. By
contrast, small oil droplets – some of which were thought to be only
10’s of microns in diameter- only weakly scatter acoustic waves which are more easily observed using
higher frequencies. Unfortunately,
higher frequencies (for example 200 kHz) do not travel as far in the ocean and
could not sample the full water column when mounted on a surface vessel.
At
the outset, little was known about the size distribution or quantity of the
subsurface oil droplets, and so we essentially embarked on missions of
exploration with the express aim of learning anything we could to help aid the
response to the oil spill. Concerns
about our echo sounders acoustically interfering with efforts to stem the oil
flow limited our access to the area where surfacing oil was prevalent. Thus, the initial cruises were mostly
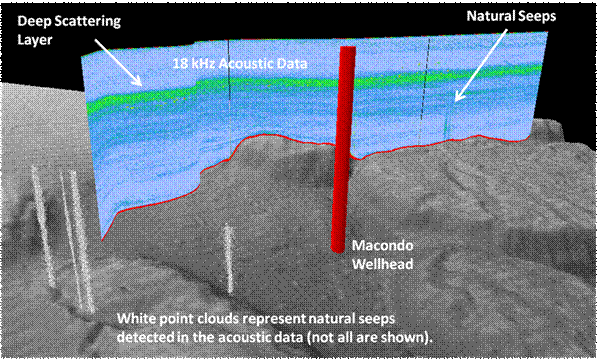
spent no closer than 10 km from the wellhead. During this time we mapped a number of
natural gas seeps while searching for changes to the deep scattering layer (a
ubiquitous community of deep-living marine organisms that scatter acoustic
waves) that might indicate the presence or effect of subsurface oil plumes
(Figure 1). Although natural seeps
commonly occur in the
Figure 1. An ‘acoustic curtain’
representing the raw 18 kHz acoustic echosounder data
exhibiting both the Deep Scattering Layer and observations of natural
seeps. The acoustic data were
processed to extract and correctly position the natural seeps (white point
clouds). The gray surface
represents the seafloor topography.
Despite
coupling our acoustic observations with other direct (fluorometer)
and indirect (dissolved oxygen) readings that indicated the presence of
subsurface hydrocarbons, no unambiguous direct acoustic observations of the oil
were made 10 km or more from the well head. The scenario changed when the NOAA Ship
Thomas Jefferson gained access to within 1.5 km of the well head. During this time, the surfacing oil
plume was detected using high frequency (200 kHz) echo sounders down to depths
greater than 150 m (Figure 2). Low
frequency (12 and 38 kHz) echo sounder data showed disturbances throughout much
of the water column, with a morphology that indicated that the source of the
disturbance was the rising oil plume (Figure 3). These observations indicated a high
potential for acoustically mapping portions of the oil plume and its local
effect on marine organisms, but no subsequent cruises were undertaken until the
well was capped in mid-July.
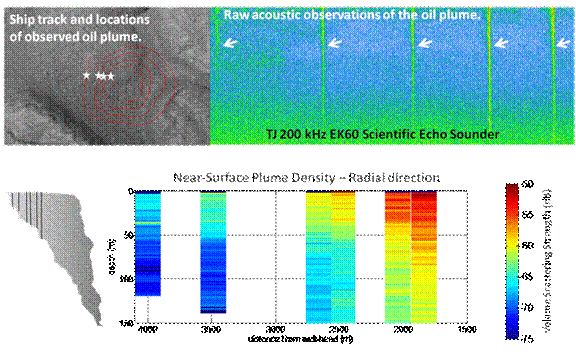
Figure 2. Near-surface (top 150 m) 200 kHz
acoustic observations of oil from the surfacing plume. Top: locations of observations (stars)
and corresponding acoustic oil plume images (arrows). Bottom: schematic representation of the
oil plume and six locations of the observations (left) with their corresponding
volume scattering strength estimates of the plume (right). Red indicates that the plume is more
dense, blue indicates less dense.
Here, the plume density is observed to decrease with increasing distance
from the well head.
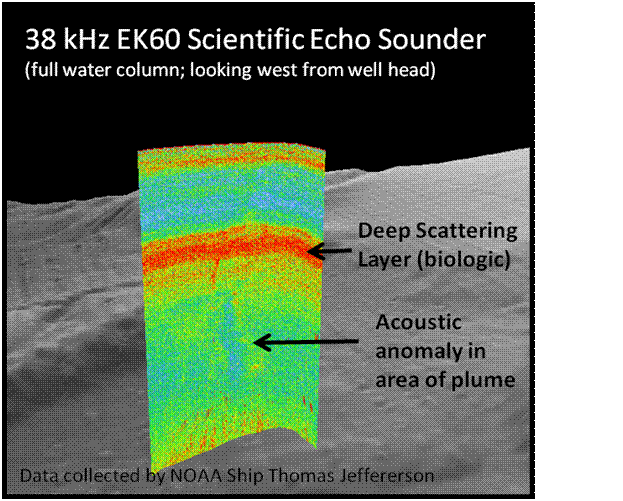
Figure 3. Acoustic observations showing anomalies
in the acoustic backscatter (38 kHz) from marine organisms. Although these are not direct
observations of the oil, the anomalies are thought to be associated with the
rising oil plume.
After
the well was capped, our focus shifted toward monitoring the integrity of the
wellhead by acoustically searching for leaking gas directly over the well head
and in the immediate vicinity.
After conducting a number of acoustic tests that indicated we would not
interfere with other on-going operations, we were given relatively unfettered
access to the site. During this
wellhead integrity monitoring stage, a small gas leak was detected on the
flange prompting an extremely high level of scrutiny including continuous video
monitoring from ROV’s and (nearly) daily acoustic observations to track
changes to the leak over time (Figure 4).
This vigilant acoustic monitoring of the capped well continued for many
weeks until the well was finally cemented in August.
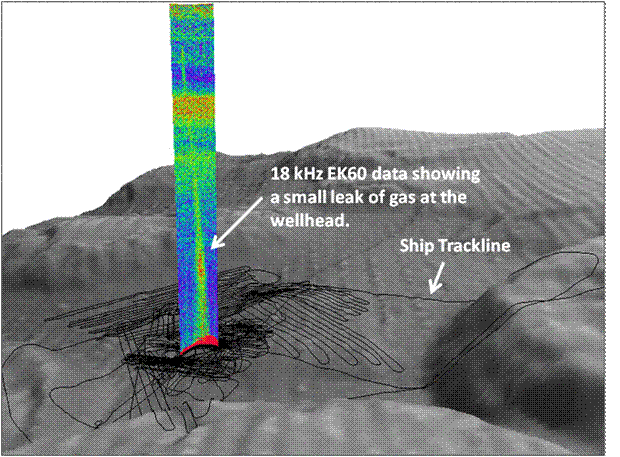
Figure 4. Acoustic observations of a small gas
leak at the Macondo wellhead several days after it
was capped in mid-July.