Jason D. Sagers – sagers@arlut.utexas.edu
Andrew R. McNeese – mcneese@arlut.utexas.edu
Preston S. Wilson – pswilson@mail.utexas.edu
Applied Research Laboratories
and
Mechanical Engineering Department
The University of Texas at Austin
Austin TX, 78758
Popular version of paper 2pEDa5
Presented Tuesday afternoon, November 1, 2011
162nd ASA Meeting, San Diego, Calif.
In 1877 Thomas Edison invented the phonograph, which was the first device capable of both recording and reproducing sound. From its initial debut, listeners were intrigued with the new possibility of “the voices of the dead being reheard through this device”1 or of the “reporter of the future” never losing time by “writing with a pen or dictating to a stenographer when the printer can set type better from the dictation of the phonograph than he can from copy.”2 In the 134 years since its invention, the methods for recording and reproducing sound have progressed from the phonograph to flat disk records, cassette tapes, CDs, and to the modern age of digital mp3s. Although older generations will be familiar with many of these media, it is increasingly common to find young students who know nothing other than digitally recorded sound, with correspondingly little understanding as to how sound is captured and replayed using their digital devices. It is for this reason that Edison’s tinfoil phonograph serves as a useful tool for teaching acoustics and providing a hands on demonstration to people of all ages.
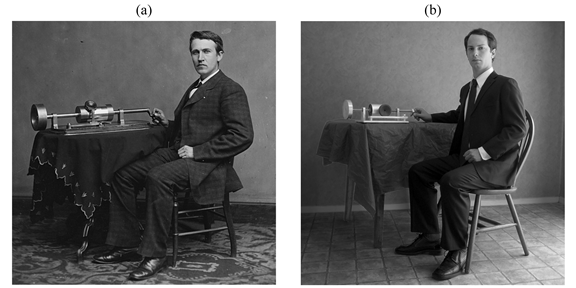
The history surrounding its invention, the simplicity of its design, and the appeal of its demonstration combine to make Edison’s tinfoil phonograph a useful tool for teaching acoustics. These reasons inspired us to construct a replica phonograph that would be accessible, as a demonstration, to educators and students alike. Like the original phonograph, the replica analyzed in this manuscript is entirely mechanical. Later electronic “improvements” were intentionally avoided in order to maintain the simplicity of the design and consequently to retain the transparency of how the phonograph worked. In some cases, we have found that recording and reproducing sound without the aid of any electronics seems to be a modern-day miracle to young students. We do not claim to have invented any new device while creating the replica phonograph; rather we have only labored to replicate Edison’s genius. Figure 1(a) shows an 1878 photograph of Edison with his phonograph and Fig 1(b) shows a 2011 photograph of one of the authors with the replica. So that the replica phonograph might be accessible to educators and students, the mechanical drawings and bill of materials were made available in Ref. 3. A video of the replica phonograph is available at www.texasacoustics.org/edisonphonograph.
Figure 1. Photograph of (a) Edison with an 1878 phonograph4 and (b) McNeese with a 2011 replica phonograph.
The basic operation of the phonograph is briefly described. For reference, a schematic of the replica phonograph is shown and labeled in Fig. 2. While speaking, the user rotates the handle. This not only rotates the foil-covered mandrel, but also advances it linearly via the threads of a screw. As for the sound, it travels from the end of the horn to the inside of the mouthpiece where it induces the vibration of the diaphragm and stylus (not visible in Fig. 2). Since the stylus is in contact with the foil, the sound-induced vibrations emboss an analogous pattern onto the foil. To play back the recording, the stylus is tracked over the embossed foil. This causes the stylus and diaphragm to vibrate in the same way that they did during the recording process, thus playing back the recorded sounds.
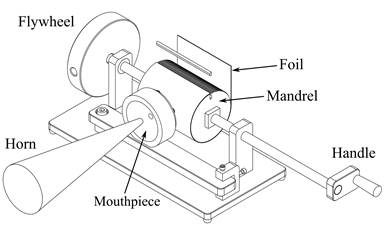
Figure 2. A schematic of the replica phonograph.
Interesting similarities are revealed when a facsimile of the foil from Edison’s first public phonograph demonstration is compared to an embossed foil made by the replica. Figure 3(a) shows Edison’s 1877 foil recording and Figure 3(b) shows a recording from the replica. At certain times during the recording, regularly spaced dimples are present on each foil. At other times, no visible dimple pattern exists. The fact that there are regularly spaced dimples at all is curious, given the wide frequency content of the human voice being captured on the foil. From Fig. 3, it would appear as if the phonograph does not record all frequencies equally, but tends to prefer particular frequencies.
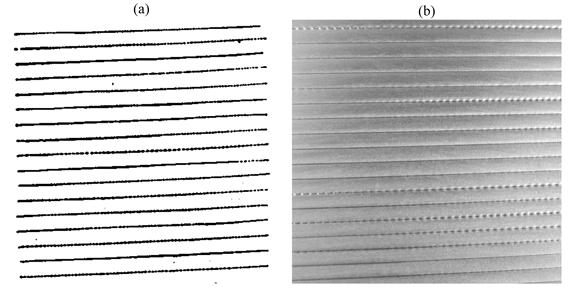
Figure 3. (a) Facsimile of embossed foil recording from Edison as shown in Ref. 1 and (b) photograph of embossed foil recording produced on the replica phonograph.
So that the replica phonograph may be a more complete tool for teaching acoustics, we analyzed its behavior through a mathematical model and laboratory measurements. An analogous circuit modeling technique was used to develop a set of mathematical equations capable of predicting the acoustic behavior of the phonograph. This technique represents physical elements (such as mechanical and acoustic masses, springs, etc.) as “analogous” electrical circuit elements. This results in an electrical circuit that can be analyzed using traditional electrical circuit theory. The model was useful to both uncover and explain why the phonograph behaves as it does.
The laboratory measurements were done with a scanning laser Doppler vibrometer (SLDV). The SLDV measured the vibrations of the phonograph diaphragm and stylus during operation, as shown in Fig. 4. The SLDV was an important tool because it allowed us to measure and visualize the vibrating surfaces of the phonograph with high precision without having to physically touch the device (doing so would have altered its motion). These laboratory measurements were then used to validate the previously mentioned mathematical model, and used to determine values of some of the unknown parameters in the model. Lastly, the data was able to illuminate when the assumptions of the model began to fail.
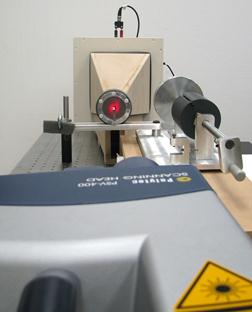
Figure 4. Scanning laser Doppler vibrometer (foreground) measurement of the replica phonograph (background).
The resulting model and measurements gave insight into the physical behavior of the phonograph. We found that the most important piece affecting the acoustic behavior of the entire system was the horn, which amplifies the sound as it travels into the phonograph during recording and out of the phonograph during playback. The horn experienced axial acoustic resonances (i.e. the horn amplified certain frequencies more than others) which caused the regularly spaced dimples of Fig. 3 to appear in the foil. The second most important component of the phonograph was the mouthpiece. The mouthpiece contains a small cylindrical hole which is backed by a narrow air cavity before being terminated by the diaphragm. The hole and cavity combine to produce an additional acoustic resonance, which enhances the range of frequencies that the phonograph can record. It was the mathematical model that allowed us to identify this behavior. Additionally, the mathematical model would be useful to a designer trying to optimize the acoustic performance of the phonograph by changing its parameters. Exploring the multitude of possible parameter combinations is much cheaper to do with a mathematical model than by building and testing a myriad of prototypes.
In reviving Edison’s tinfoil phonograph we discovered that it gave us much more than an acoustics demonstration. Like the voices of the dead permanently embossed by the phonograph, the innovative spirit of the “wizard of Menlo Park” is once more imprinted on young minds. Edison’s phonograph would not be considered high-fidelity audio by today’s standards, yet it speaks to us with clarity, that science and innovation are worth the effort.
REFERENCES