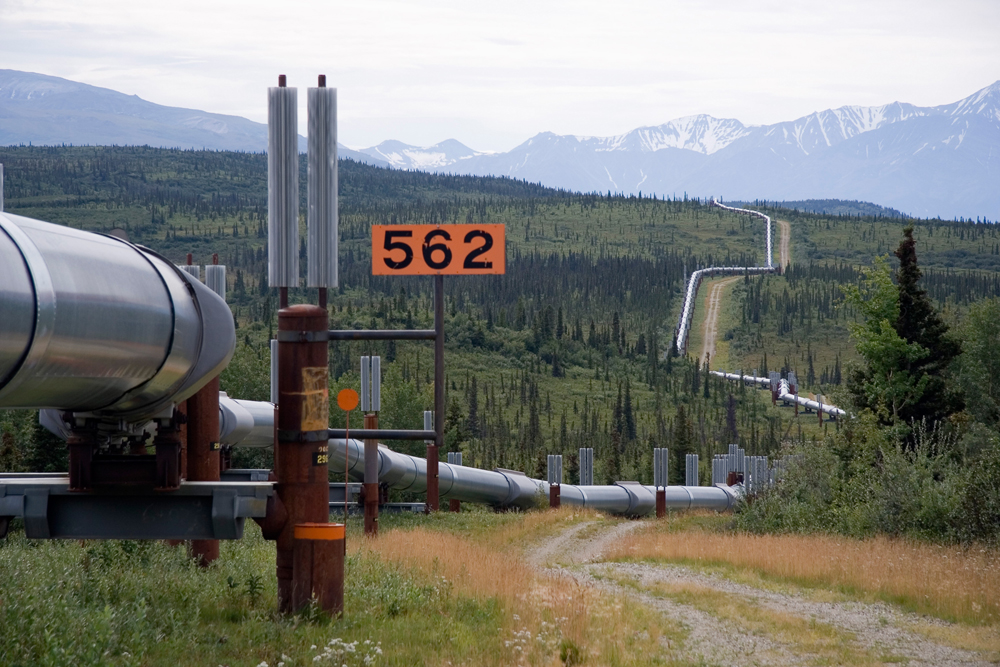
Figure 1. Trans-Alaska Pipeline [2].
Andrea Galvagni – a.galvagni08@imperial.ac.uk
Peter Cawley – p.cawley@imperial.ac.uk
Michael Lowe – m.lowe@imperial.ac.uk
Department of Mechanical Engineering
Imperial College London, UK
Popular version of paper 2aSAb1
Presented Tuesday Morning, October 23, 2012
164th ASA Meeting, Kansas City, Missouri
Introduction
Petroleum is an incredibly versatile substance that lies at the basis of the world's energy mix and of modern life. Its derivatives include not just fuels for transportation and heating but also agricultural fertilisers, plastics, textiles, medicines, cosmetics, and many other everyday products. However, petroleum transportation is complex and very risky. Pipelines are by far the quickest, safest and most cost-effective way to transport the vast quantities of petroleum consumed worldwide every day [1]. For comparison, transporting the equivalent of a modest pipeline would require a constant line of tanker trucks loading, driving and unloading 24/7, increasing transportation costs, pollutants emitted, and chances for accidents.
|
Figure 1. Trans-Alaska Pipeline [2]. |
Ultrasonic Guided Wave Pipeline Health Monitoring
Conventional ultrasonic and electromagnetic sensors detect the growth of damage such as corrosion by measuring the thickness of the pipe wall just below the sensor contact position. Therefore, impractically large numbers of permanently installed, remotely operated conventional sensors would be required to monitor damage growth in even short lengths of pipeline. Conversely, a single permanently installed ultrasonic guided wave sensor can monitor damage growth over many metres of pipe, and consequently represents a very advantageous option since it becomes practical to deploy enough sensors to monitor an entire pipeline.
Ultrasonic guided waves are routinely utilised to inspect petrochemical pipelines worldwide [5]. Using a collar-shaped sensor, torsional guided wave pulses are transmitted along a pipe. Torsional guided waves can be imagined as a twisting motion of the pipeline cross-section. The pulses travel along the pipe and are partially reflected by any discontinuity, from features such as welds and supports to damage such as cracks and corrosion. Reflected echoes then travel along the pipe back to the sensor where they are detected and utilised to locate and characterise discontinuities, as exemplified in Fig.2.
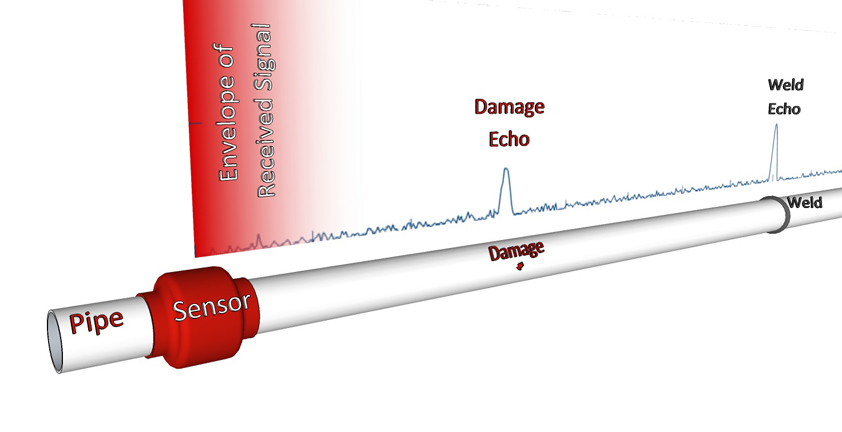 |
Figure 2. Ultrasonic guided wave pipeline inspection diagram. |
However, implementing a guided wave structural health monitoring system is complex. The first challenge is the relatively low sensitivity of ultrasonic guided waves to damage, which might only become evident when it has reached a significant and potentially critical size. This is because damage echoes can be masked by large feature echoes as well as by coherent noise. Coherent noise is non-random and consists of unwanted guided waves whose generation can be minimised by the best equipment, but never completely eliminated. Damage sensitivity can be particularly low for intricate pipe networks, such as those in petrochemical plants, because the relatively high feature density results in many overlapping feature echoes that can mask even large damage echoes.
Having relatively low damage sensitivity is inconvenient for a structural health monitoring system. Fortunately, permanently installed sensors can perform highly accurate repeat inspections. Damage sensitivity can then be increased using baseline subtraction, which highlights changes between successive inspections and therefore reveals damage growth [6].
Baseline Subtraction
In baseline subtraction, an initial baseline inspection is performed when the pipeline is in a known health condition, whether undamaged or partially damaged, to record the baseline signal. On successive inspections, the baseline signal is subtracted from the newly recorded signals to obtain residual signals. During subtraction the echoes from all features and pre-existing damage in their known, baseline health condition should cancel out, and so should coherent noise, which is non-random. Residual signals should thus only include random noise and information about damage growth in the pipeline since the baseline was recorded, as shown in Fig.3.
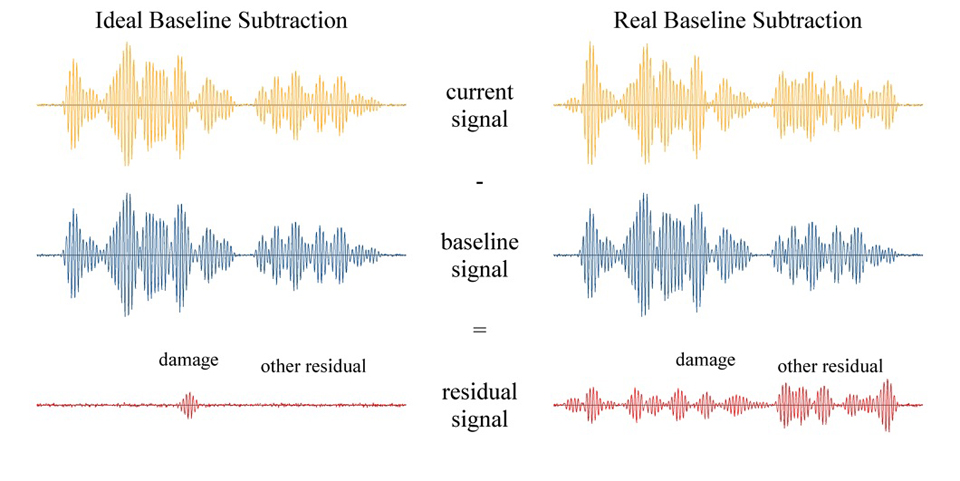 |
Figure 3. Baseline subtraction diagram showing ideal (left) and real (right) subtraction. |
In baseline subtraction it is assumed that the baseline component of recorded signals remains stable over time. In other words echoes from features, such as welds and supports, and from pre-existing damage are assumed to remain constant over time unless further damage develops. Unfortunately, this assumption is false under most circumstances because the baseline component will change over time as a function of many benign environmental effects and primarily of changes in the operating temperature of the monitored pipeline. Consequently, significant efforts have been made to better understand their impact and therefore design signal processing techniques to compensate for them, such as Optimal Baseline Selection (OBS), Localised Baseline Signal Stretch (LBSS), and Attenuation Match (AM). However, even complex and advanced compensation techniques cannot entirely compensate for complex environmental effects such as variations in coherent noise and the variable echoes produced by exotic pipeline features.
Statistical Damage Detection
Managing false damage indications, presently originating from uncompensated environmental effects, is the single biggest challenge for any structural health monitoring system, and is just as important as detecting real damage. For example, suppose that the echo from a weld in a new inspection is significantly different from the echo from the same weld in a baseline inspection. The obvious question is whether the change is symptomatic of damage growth at the weld or is just the result of uncompensated environmental effects, and therefore whether the presence of the change should be notified to the pipeline operator or not.
To address this challenge, consider a pool of baseline signals gathered in different environmental and operating conditions, as shown in Fig.4. By definition baseline signals will not contain any damage growth information. It follows that any change between baseline signals must be caused by uncompensated environmental effects. These changes can be isolated through baseline subtraction and statistically modelled. When new, non-baseline signals are recorded during successive inspections, the baseline statistical models can be used to analytically determine the probability that any signal change is consistent or inconsistent with those observed between the baselines, and therefore whether it is just caused by environmental effects or it is an actual damage indication. Equivalently, for prescribed probabilities of calling a false damage indication and of detecting an actual damage indication, a threshold can be drawn to show the minimum damage that can be detected on the pipeline at any position and at any time in the future, as shown in Fig.4.
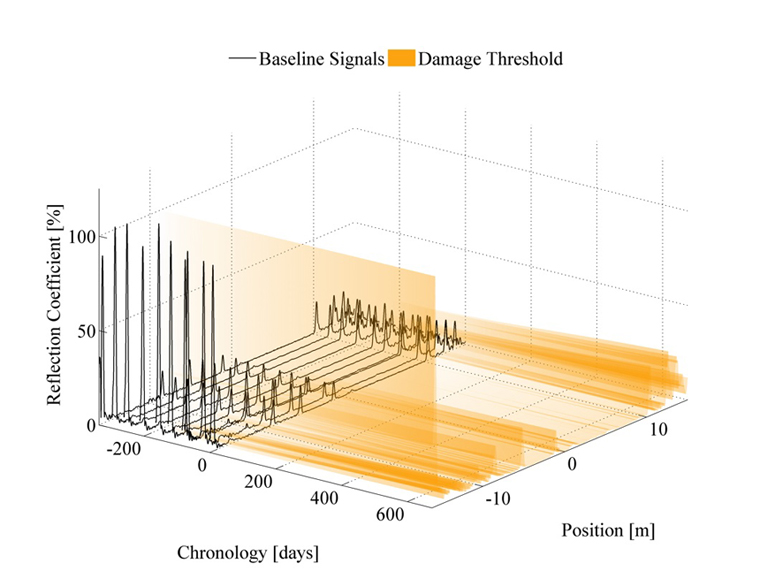 |
Figure 4. Baseline signals and statistical minimum damage detection threshold for 99.9% probability of detecting an actual damage indication and 0.1% probability of false calling. |
Conclusions
In response to the needs to monitor the structural health of petrochemical pipelines, a complete remotely operated solution based on ultrasonic guided waves has been developed. This solution has the unique capability of quantitatively evaluating the probabilities that an observed change is a false or an actual damage indication. These probabilities can then be fed into plant management procedures to determine the best maintenance schedule to minimise pipeline downtime while ensuring no damage remains undetected.
References:
1. Pipeline and Hazardous Materials Safety Administration (PHMSA). (2007). Safe Pipelines FAQs. Available: http://phmsa.dot.gov/about/faq. Last accessed 25 Sept 2012.
2. MATCOR. (2011). Alyeska, federal regulators reach settlement on January oil leak. Available: http://integritythatworks.wordpress.com/2011/10/10/alyeska-federal-regulators-reach-settlement-on-january-oil-leak/. Last accessed 25 Sept 2012.
3. Chanjaroen, Chanyaporn and Dobson, Paul. (2011). Alaskan Pipe Shutdown Cuts Oil Output, Raises Prices. Available: http://www.bloomberg.com/news/2011-01-10/alaskan-oil-pipeline-shutdown-cuts-production-pushes-crude-prices-higher.html. Last accessed 25 Sept 2012.
4. Cohn, Scott. (2011). Alaska Pipeline Problem Signals Future Oil Shortages. Available: http://www.cnbc.com/id/41044074/Alaska_Pipeline_Problem_Signals_Future_Oil_Shortages. Last accessed 25 Sept 2012.
5. D. N. Alleyne, B. N. Pavlakovic, M. J. S. Lowe, P. Cawley, "Rapid, long range inspection of chemical plant pipework using guided waves", Insight, vol. 43, pp. 93-96, 101, 2001.
6. A. Galvagni and P. Cawley, "Guided wave permanently installed pipeline monitoring system", Review of Progress in QNDE, vol. 31, pp. 1591-1598, 2011.