The Position of the Sound Source in Churches
Umberto Berardi – uberardi@wpi.edu
Civil and Environmental Engineering Department
Worcester Polytechnic Institute
100 Institute Road
Worcester, MA 01609
Francesco Martellotta – francesco.martellotta@poliba.it
Dipartimento di Scienze dell'Ingegneria Civile e dell'Architettura (DICAR)
Politecnico di Bari
via Orabona n.4
Bari, ITALY 70125
Popular version of paper 1pAA4
Presented Monday afternoon, May 5, 2014
167th ASA Meeting, Providence
---------------------------------
The position of hte sound source is an aspect rarely considered in room acoustics because the shape of the space and its internal organization generally make clear where the sound source should be. However, this may not be the case in some buildings, such as churches. Here, there are several sound sources which make the study of the acoustics quite complex. Particularly in modern liturgy, the priest tends to be the main focus of the celebration, and he usually moves between the altar, the pulpit, and the seat. However, the organ and the choir play a significant role as they are responsible of liturgical music. In order to accommodate architectural and liturgical evolution, organ and choir have historically been located in different positions. Symmetrical positions, such as having the organ at the beginning or at the end of the main axis, guarantee a symmetrical distribution of the sound. However, the large dimensions of the churches and the distances vbetween the altar and the pews historically pushed the pulpit in asymmetrical positions closer to worshippers. Similarly, it is unusual to find the organ along the main nave, in the women's gallery. Figure 1 shows examples of the bariability of the position of the organ through the centuries.
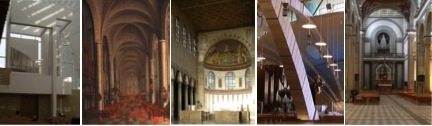
Figure 1. Existing churches with organ in the five positions (from left to right): Jubilee Church Dives in Misericordia (Rome), St. Michael's Church (Luneburg, Germany), Basilica of Santa Sabina all'Aventino (Rome), Padre Pio Pilgrimage Church (San Giovanni Rotondo, Italy) and Basilica of San Lorenzo (Florence).
This paper only considers five positions:
– above the entrance of the church, a position common before the Second Vatican Council (position A);
– in the center of the room, with the organ positioned over the central nave, in the matroneum;
– between the altar and the worshippers, a position common after the Second Vatical Council (position C);
– at the side of the altar, in an asymmetrical position (position D);
– in line with the longitudinal axis of the church and suspended behind the altar (position E).
Having considered the complexity of historical churches, it was decided to simulate box-shaped churches only. Different ratios between the lenght and width were considered. In this way, different shapes were selected from longitudinal churches (length to width ration 2:1), square (1:1) and transversal (1:2) shapes. Several columes were considered to assess the variability of the acoustic parameters, where the properties of the materials were assigned according to a large database developed at the Politecnico de Bari (I) in more than 15 years of research on church acoustics.
Figure 2 reports the values of Ts and C80 averaged among the different source and receiver positions considered in this study together with the relative standard deviarions. This figure allows considering how the same acoustic parameter is affected by a change in the position of hte sound source.
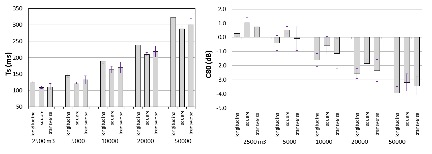
Figure 2. Average values of Ts and C80 for source in A, B, C, D and E in churches of different shape and volume, and relative standard deviations among values in different positions of the sound source.
Figures 3-5 show the results for the longitudinal, square or transversal plan of 10,000 m3 volume of both the center time and the lateral fraction.
In longitudinal churches (Figure 3), the Ts has low values close to the source and progressively longer ones as distance grows. This means that with this shape the positions A and E result in considerable differences among the pew positions, whereas a symmetrical position in the middle of the church (such as position B) guarantees an even distribution of Ts. Figure 3 also shows JLF values. In general, the reduced width of this shape helped obtaining high values when the source was on the shorter sides. In these cases, values aboce 20% were obtained with a general homogeneity among pews.
The transversal typology is often considered a good geometry to help the participation of worshippers to the Mass. Figure 4 shows even values of the Ts when the source is in E or in A. This suggests good behaviour for speech intelligibility, but probably less than ideal conditions for music. In the transversal typology, the JLF assumes low values when the source is behind the altar (13.3% on average both in A). This shows that the source behind the altar has to be discouraged, or alternatively, systems to increase lateral reflections are to be designed.
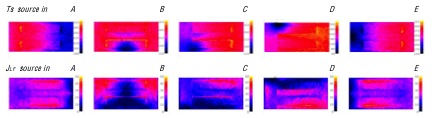
Figure 3. Color maps of Ts (in ms) and JLF (in %) at 500 Hz for a stretch longitudinal church of 10,000 m3 with different source locations (A, B, C, D and E refer to the different positions of the source.)
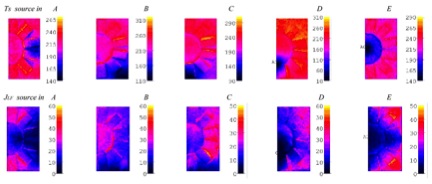
Figure 4. Color maps of Ts (in ms) and JLF (in %) at 500 Hz for a transversal longitudinal church of 10,000 m3 with different source locations (A, B, C, D and E refer to the different positions of the source).
The square typology prevented significant differences between different source positions, as in this typology, the distance between source and receiver was minimized. The maps show that if the sound source is near to the pews (such as B or D), the Ts assumes low values in all the pew positions. Relatively larger differences of JLF among the receivers are obtained for different positions of the source. In fact, the color maps show that the pews which are on the sides of the altar had JLF values below 20% when the source is behind the altar or close to the pews. In these cases systems to increase lateral reflections should be encouraged.
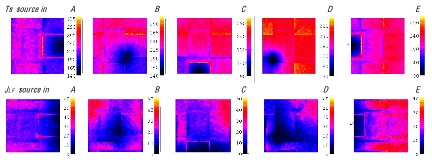
Figure 5. Color maps of Ts (in ms) and JLF at 500 Hz for a square church of 10,000 m3 with different source locations (A, B, C, D and E refer to the different positions of the source).
Figure 6 shows the average values of C80, Ts, JLF, and G for different volumes. The graphs show that the acoustical conditions within the churches were strongly influenced by the typology of the church wheneever the volume was larger than 10,000 m3. The source in position A gave higher values of C80 than the source at D. However, this was not the case for the stretched transversal typology. Churches with small volume (5,000 m3) showed good values of JLF for every typlogy, but results show that the JLF was hugher when the source was in position A than in D. This shows that a traditional location of the organ (position A) resulted in higher values of JLF than locations more common in new buildings, such as the position D. The worst condition for the lateral effects of the sound was given by the stretched transversal typology with the highest volume, where average values of JLF were low. The analysis of Ts showed that only for the larger volumes, the source should be positioned in a way to reduce the distance from the worshippers.
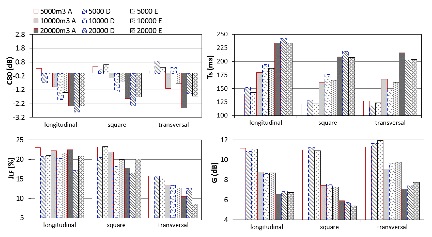
Figure 6. Average values of C80, JLF, and Ts in churches of different shapes and volumes with the sound source in position A (above the entrance door), D (on the ground vetween altar and pews) and E (end of the church).
Simulations in this study were realized using an omnidirectional sound source. Future studies should consider non-omnidirectional sources and the effect of multiple sources at the same time.