Investigation of Acoustical Parameters in the South Indian Musical Intervals
Gopu R. Potty – potty@egr.uri.edu
Department of Ocean Engineering
University of Rhode Island
Narragansett, RI 02882
Venkitanarayanan Parameswaran – venkit@iitk.ac.in
Department of Mechanical Engineering
Indian Institute of Technology
Kanpur - 208 016, INDIA
Popular version of paper 1pMU2
Presented Monday afternoon, May 5, 2014
167th ASA Meeting, Providence
---------------------------------
Introduction
Indian classical music is one of the oldest forms of music in the world. Two of the major styles of classical music of India are the Hindustani (Northern India) and Carnatic (Southern India). Indian music is melodic in nature, as opposed to Western music which is harmonic. Unlike the case in Western music, the musical notes used in Indian music are not at standardized frequencies. One may choose any frequency of convenience as the reference, and this frequency would then act as the tonic or base of reference for the music to be presented.
Pairs of notes, where the frequency of the higher note is twice that of the lower note, define a range of notes called an octave. We hear notes spaced apart by octaves as being in a sense "the same note." Such a higher note, and further notes that are at integer multiples of the frequency of the lower note referred to, are called the harmonics of the lower note. It is believed by musicologists that the human ear is capable of distinguishing at the most 22 musically different or significant notes within any given octave. These notes are referred to as micro-notes.
Seven of these notes are considered to be the basic notes or swara -s in Indian classical music.
The basic reference note (tonic) is called shadja (abbreviated as Sa). The remaining notes in an octave are defined with reference to Sa, and are called rishabh (Re), gandhaar (Ga), madhyam (Ma), pancham (Pa,), dhaivat (Dha), and nishad (Ni). (These notes correspond approximately to the notes C, D, E, F , G, A and B in the Western music scale if C is chosen as the tonic).
The combination of several notes woven into a composition in a way which is pleasing to the ear is called a raagam or raga. Raagam is the basis of Indian classical music. A raga is a group of notes (swaras) selected out of the twenty two note intervals of the octave which are defined in their ascent and descent within an octave. In addition, it will include appropriate microtones or ornamental notes (gamakams). It is a melodic structure governed by rigid rules but it allows the practitioners a great deal of freedom to improvise. Ragas are derived from scales with particular combinations of notes with a definite relationship to the tonic which when sung evoke certain moods and emotions. The swaras of a raga have to be strictly adhered to and only permitted deviations which enhance the aesthetic quality of the raga are possible. A peculiar and inseparable part of Carnatic ragas is the gamaka. Gamaka is a collective term given to the various shakes, graces, ornaments and embellishments used in South Indian music. These gamakams can be slides, deflections, stress from above or below on repeated tones or sharp dynamic accent (Swift, 1990). The easiest way to identify a ragam is by analogy and by the presence of a recurring characteristic phrase. Some of the ragams can be so distinctive that you can recognize them when only two or three phrases are played, thanks to the characteristic phrases. The notes, which are at different frequencies, are presented one at a time in South Indian music; continuity is provided both in time and frequency through tonal graces (gamakams).
We now explore a representative audio sample of Carnatic music using signal processing techniques to investigate the evolution of the notes in the time-frequency plane. We focus on frequency and its evolution with time since the cochlea in our ears works as a frequency analyzer by breaking down the sound according to its frequency content. Time-frequency analysis using short time Fourier Transform and Empirical Mode Decomposition (EMD) is performed to unravel the time-frequency characteristics of the music signal. A brief description of this analysis is provided in the following sections.
Time-frequency analysis of musical signal
The time frequency analysis produces figures in which the strength of the audio signal is displayed as a function of time and frequency (Figures 1, 2 and 3). For example, the horizontal red line in Figure 1 at 314 Hz indicates that the audio sample has a strong constant frequency component at this frequency which lasts from 0.15 seconds to 1.25 sec. If the frequency of the audio signal varies with time, that will be reflected in the time-frequency diagram as curvy patterns (right panel in Figure 1 and Figures 2 and 3). We use Short Time Fourier Transform (STFT) to analyze the whole audio signal and Empirical Mode Decomposition (EMD) to zoom in parts of the signal to highlight some of the gamakams.
A time-frequency analysis was performed using Fourier based spectrogram on a very short piece of music to visualize the time and frequency structure of the musical signal. The analysis was done on two samples of the raga called mohanam; one played without gamakams while the other had gamakams included. For the sake of simplicity this pentatonic (five notes) raga is selected and only very simple gamakams are considered. The time-frequency content of a raga – mohanam – obtained by this analysis is shown in Figure 1. The left panel shows the pure notes without any micro-tonal (gamakam) present. The sequence of notes in ascending order is Sa, Re, Ga, Pa, Dha and Sa as marked in Figure 1. The frequencies corresponding to these notes are tabulated in Table 1. The sequence reverses in the descent. The right panel shows the same raga played with gamakams (as usually done in practice).The transition from one note to the next is now more complicated due to the presence of gamakams as shown in the right panel. The effect of including these gamakams in the smooth transition from one note to the next can be heard in the two audio files included below. The file mohanam_plain.wav corresponds to the left panel of Figure 1 and mohanam_gamakam.wav corresponds to the right panel.
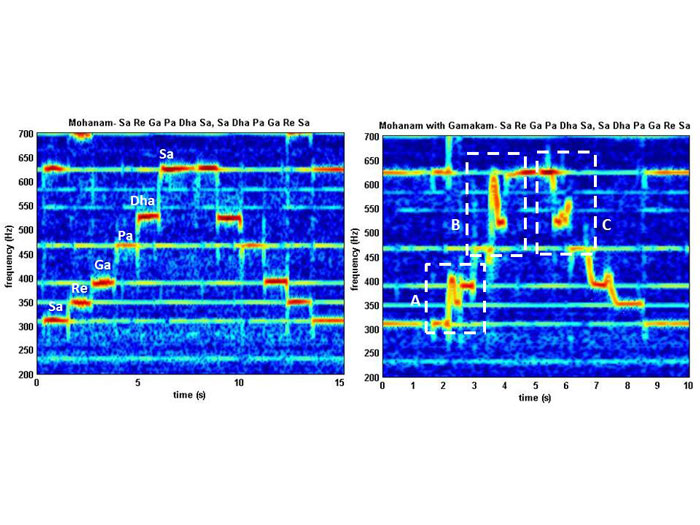
Figure 1. The Fourier spectrograms of the rendition of ragam ‘mohanam’. The sequence of notes (Sa, Re, Ga, Pa, Dha and Sa ) are marked on the left panel. The right panel shows the changes in the time-frequency structure when ‘gamakams’ are included. Figure 3 shows the zoomed in portions of the right panel corresponding to the two white boxes marked A and B. (played by V. Parameswaran on violin)
The observed frequencies of the notes match closely with the expected frequencies based on the frequencies of the tonic (Sa) and the frequency ratios corresponding to each note. These frequencies can be clearly observed in the left panel of Figure 1. The transition from Re to Ga and that from Dha to Sa becomes more complex and dynamic when the raga is played with gamakams as highlighted in the white boxes A, B and C in Figure 1 (right panel). The portions of the audio signal highlighted in the boxes A, B and C are further explored in detail using a technique called Empirical Mode Decomposition. The results of this detailed analysis are discussed in the following section and are shown in the expanded views in Figure 2 and 3.
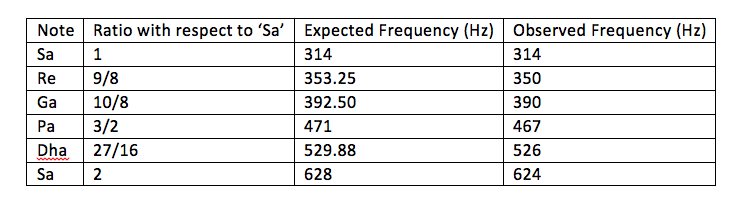
Table 1. The expected and observed frequencies for the notes in the musical signal shown in Figure 1.
Empirical Mode Decomposition of the music signal
Empirical Mode Decomposition (EMD) is an adaptive tool to analyze non-stationary signals which decomposes the constituent parts of the signal based on the local behavior of the signal (Heydarian and Reiss, 2005). EMD is a multi-scale technique, in which information at different scales is captured by so-called intrinsic mode functions (IMFs) that are constructed in an adaptive (i.e., data-driven) manner. Details of the implementation of this method can be found in Rilling et al. (2003). The IMFs corresponding to different modes enable us to closely examine different frequency bands as shown in Figures 2 and 3.
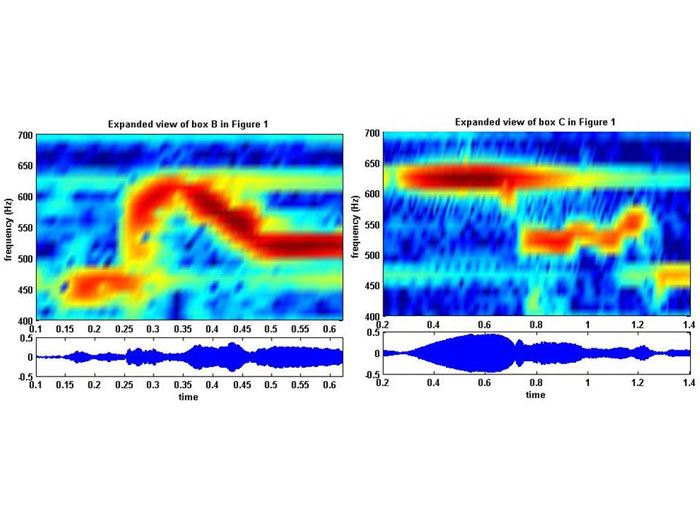
Figure 2. The sequence of the notes Pa, Dha and Sa in the ascend and descend. Left panel correspond to the portion of the music signal highlighted in box B and right panel correspond to box C in Figure 1. The top panels show the time-frequency diagram and bottom panels show the corresponding signal in time domain.
The time-frequency structure in Figures 2 and 3 shows the nature of transition from note to note when gamakam is included. Figure 2 shows the sequence of notes Pa, Dha and Sa in the ascend (left panel) and descend (right panel). The top panels show the time-frequency diagrams and bottom panels show the time series. The differences in transition in ascend and descend are clearly evident in both the time series and in the time-frequency domain. Figure 3 compares the first three notes (Sa, Re and Ga) and the last 3 notes (Pa, Dha and Sa) in the ascend. The transition shown in the left and right panels appears similar. The note Sa transitions into Ga and then come down to Re in the left panel whereas a similar transition pattern can be observed in the right panel for Pa-Dha and Sa. It should be emphasized that these are the simplest of the gamakas, and as the musician unfolds the raga many other complex gamakams will be used. Gamakams, their type, pattern and usage is heavily raga dependent even when the base note upon which the gamaka is imposed is the same.
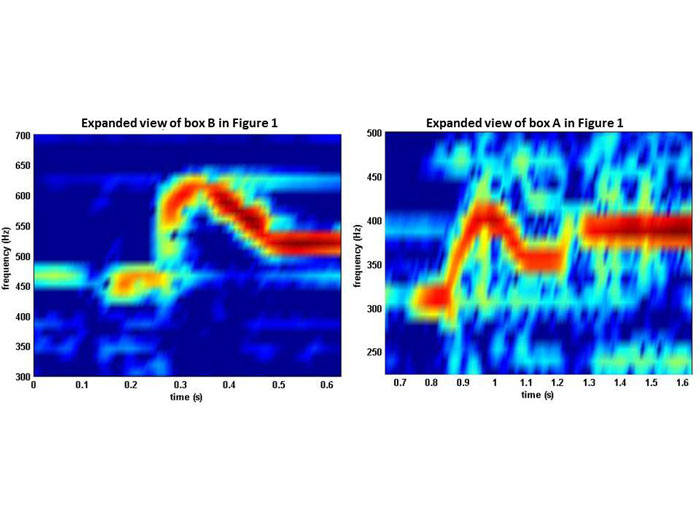
Figure 3. The time-frequency structure of portions of the music signal highlighted in boxes B (left panel) and A (right panel) in Figure 1. Left and right panels show the transitions Pa-Dha_Sa and Sa-Re-Ga respectively.
Departures from the acoustical parameters
In music theory, an interval is the difference between two pitches. An interval may be described as melodic if it refers to successively sounding tones, such as two adjacent pitches in a melody, and vertical or harmonic if it pertains to simultaneously sounding tones, such as in a chord. Intervals defined by simple integer ratios have a prominent role in Western music. Other than a few intervallic relationships (octave, the fifth, the fourth and the major third), Carnatic music intervals are melodic. The complexity of the raga (as evidenced in Figures 1 and 3) makes it very hard to define musical intervals based on simple integer ratios. The complex variation in time and frequency as seen in Figures 1 through 3 can only be described using complex mathematical models.
To better appreciate the pitching scheme in Carnatic music, we need to understand the hearing and perception aspects of music. We presented our results in terms of frequency, but pitch is the perceptual correlate of frequency. As mentioned earlier, the filtering in the cochlea provides a frequency-to-place (tonotopic) mapping which breaks down the sound according to its frequency content. This frequency mapping is preserved in the auditory system up to and including the auditory cortex (McDermott and Oxenham, 2008). But it is now believed that cortical neurons beyond primary auditory cortex are tuned to pitch. In addition to the absolute pitch, relative pitch (differences in pitch between successive notes) is important in how we perceive music (McDermott and Oxenham, 2008). Since the tonotopic organization is based on pitch (not on frequency), individual learning patterns and cultural context play an important role as opposed to frequencies of the acoustic stimuli (Komaragiri, 2012). In summary, the melodic intervals are pitched and perceived differently from harmonic intervals and are not solely dependent on the physics of vibrations.
Summary
Based on the limited analysis presented, it is clear that the raga based pitching in Carnatic music creates complex musical are dynamic in nature. The intonation is not acoustically driven but psycho-physiologically driven as observed earlier also (Komaragiri, 2012). We plan to investigate further the complex dynamic structure of the pitching structure in Carnatic music.
Acknowledgement:
We acknowledge the Acoustics Laboratory of IIT Kanpur (India) for extending the recording facilities used in this work.
References:
Heydarian, P., and Reiss, J. D., “Extraction of Long-term rhythmic structures using the Empirical Mode Decomposition,” Proc. AES 122nd Convention, Vienna, Austria, 2007 May 5–8
Komaragiri, M. M, “Departures from the acoustical parameters in the intonation of South Indian Musical Intervals,” Canadian Acoustics, 40(4), 3-11, (2012)
McDermott, J. H. and Oxenham, A. J, “Music perception, pitch and the auditory system,” Current Opinion in Neurobiology, 18, 452-463, (2008)
Rilling, G., Flandrin, P., and Gonçalves, P., “On Empirical Mode Decomposition and its Algorithms,” IEEE-EURASIP Workshop on Nonlinear Signal and Image Processing NSIP-03, 2003.
Swift, G. N., “South Indian Gamaka and the Violin,” Asian Music, the Journal of the Society for Asian Music, Volume XXI-2, (1990).