1aPAb1 – On the origin of thunder: reconstruction of lightning flashes, statistical analysis and modeling

Arthur Lacroix – arthur.lacroix@dalembert.upmc.fr
Thomas Farges –thomas.farges@cea.fr
CEA, DAM, DIF, Arpajon, France

Régis Marchiano – regis.marchiano@sorbonne-universite.fr
François Coulouvrat – francois.coulouvrat@sorbonne-universite.fr
Institut Jean Le Rond d’Alembert, Sorbonne Université & CNRS, Paris, France

Popular version of paper 1aPAb1
Presented Monday morning, November 5, 2018
176th ASA Meeting, Vancouver, Canada

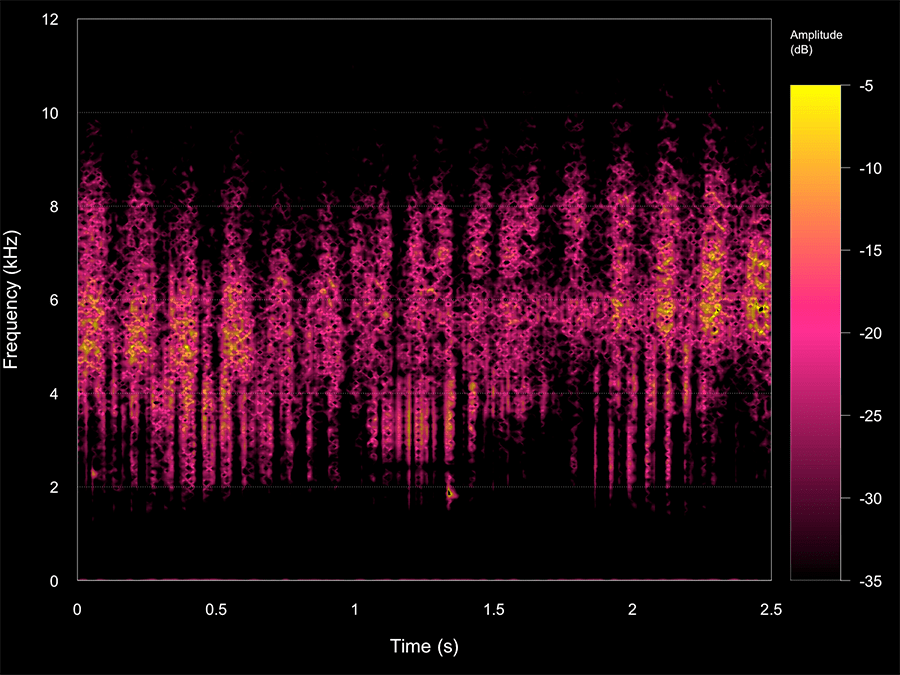
Thunder is the sound produced by lightning, a frequent natural phenomenon occurring in the mean about 25 times per second somewhere on the Earth. The Ancients associated thunder with the voice of deities, though old Greek scientists like Aristotle invoked some natural causes. Modern science established the link between lightning and thunder. Although the sound is audible, thunder also contains an infrasonic frequency component, non-audible by humans, whose origin remains controversial. As part of the European project HyMeX on the hydrological cycle of the Mediterranean region, thunder was recorded continuously by an array of four microphones during two months in 2012 in Southern France, in the frequency range of 0.5 to 180 Hz covering both infrasound and audible sound. In particular, 27 lightning flashes were studied in detail. By measuring the time delays between the different parts of the signals at different microphones, the direction from which thunder comes is determined. Dating the lighting ground impact and therefore the emission time, the detailed position of each noise source within the lightning flash can be reconstructed. This “acoustical lightning photography” process was validated by comparison with a high frequency direct electromagnetic reconstruction based on an array of 12 antennas from New Mexico Tech installed for the first time in Europe. By examining the altitude of the acoustic sources as a function of time, it is possible to distinguish, within the acoustical signal, the part that originates from the lightning flash channel connecting the cloud to the ground, from the part taking place within the ground. In some cases, it is even possible to separate several cloud-to-ground branches. Thunder infrasound comes unambiguously mainly from return strokes linking cloud to ground. Our observations contradict one of the theories proposed for the emission of infrasound by thunder, which links thunder to the release of electrostatic pressure in the cloud. On the contrary, it is in agreement with the theory explaining thunder as resulting from the sudden and intense air compression and heating – typically 20,000 to 30,000 K – within the lightning stroke. The second main result of our observations is the strong dependence of the characteristics of thunder with the distance between the lightning and the observer. Although a common experience, this dependence has not been clearly demonstrated in the past. To consolidate our data, a theoretical model of thunder has been developed. A tortuous shape for the lightning strike between cloud and ground is randomly generated. Each individual part of this strike is modeled as a giant spark, solving the complex equations of hydrodynamics and plasma physics. Summing all contributions, the lightning stroke is transformed into a source of noise which is then propagated down to a virtual listener. This simulated thunder is analyzed and compared to the recordings. Many of our observations are qualitatively recovered by the model. In the future, this model, combined with present and new thunder recordings, could potentially be used as a lightning thermometer, to directly record the large, sudden and yet inaccessible temperature rise within the lightning channel.

acoustical lighting photography

2pSC34 – Distinguishing Dick from Jane: Children’s voices are more difficult to identify than adults’ voices

Natalie Fecher – natalie.fecher@utoronto.ca
Angela Cooper – angela.cooper@utoronto.ca
Elizabeth K. Johnson – elizabeth.johnson@utoronto.ca

University of Toronto
3359 Mississauga Rd.,
Mississauga, Ontario L5G 4K2 CANADA

Popular version of paper 2pSC34
Presented Tuesday afternoon, November 6, 2018, 2:00-5:00 PM, UPPER PAVILION (VCC)
176th ASA Meeting, Victoria, Canada

Parents will tell you that a two-year-old’s birthday party is a chaotic place—young children running around, parents calling out to their children. Amidst that chaos, if you heard a young child calling out, asking to go to the bathroom, would you be able to recognize who’s talking without seeing their face? Perhaps not easily as you might expect, suggests new research from the University of Toronto.

Adults are very adept at recognizing other adults from only their speech. However, children’s speech productions differ substantially from adults, arising from differences in the size of their vocal tracts, to how well they can control their articulators (e.g., tongue) to form speech sounds, to differences in their linguistic knowledge. As a result, a child may pronounce words like elephant and strawberry more like “ephant” and “dobby”. We know very little about how these differences in child and adult speech might affect our ability to recognize who’s talking. Previous work from our lab demonstrated that even mothers are surprisingly not as accurate as you might expect at identifying their own child’s voice.

Sample of 4 adult voices 

4 child voices producing the word ‘elephant’

In this study, we used two tasks to shed light on differences between child and adult voice recognition. First, we presented adult listeners with pairs of either child or adult voices to determine if they could even tell them apart. Results revealed that listeners were substantially worse at differentiating child voices relative to adult voices.

The second task had new adult listeners complete a two-day voice learning experiment, where they were trained to identify a set of 4 child voices on one day and 4 adult voices on the other day. Listeners first heard each voice producing a set of words while seeing a cartoon image on the screen, so they could learn the association between the cartoon and voice. During training, they heard a word and saw a pair of cartoon images, after which, they selected who they thought was speaking and received feedback on their accuracy. Finally, at test, they heard a word and saw 4 cartoon images on the screen and selected who they thought was speaking (Figure 1).

Children’s voices

Figure 1. Paradigm for the voice learning task

Results showed that with training, listeners can learn to identify children’s voices above chance, though child voice learning was still slower and less accurate than adult voice learning. Interestingly, no relationship was found between a listeners’ voice learning performance with adult voices and their voice learning performance with child voices, such that those who were relatively good at identifying adult voices were not necessarily also good at identifying child voices.

This may suggest that the information in the speech signal that we use to differentiate adult voices may not be as informative for identifying child voices. Successful child voice recognition may require re-tuning our perceptual system to pay attention to different cues. For example, it may be more helpful to attend to the fact that one child makes certain pronunciation errors, while another child makes a different set of pronunciation errors.

1pAB1 – Listening to rivers and lakes to help conservation in freshwater environments

Camille Desjonquères1,2,3desjonqu@uwm.edu
Fanny Rybak3, Toby Gifford4, Simon Linke5, Jérôme Sueur2

1 Molecular and Behavioural Ecology Group, Department of Biological sciences, University of Wisconsin-Milwaukee, Milwaukee, United States
2 Muséum national d’Histoire naturelle, Institut Systématique, Evolution, Biodiversité, ISYEB, UMR 7205 CNRS MNHN UPMC EPHE, 45 rue Buffon, 75005 Paris, France
3NeuroPsi, CNRS UMR 9197, Bâtiment 446, Université Paris-Sud, 91405 Orsay cedex, France
4SensiLab, Monash University, Caulfield, VIC 3045, Australia
5Australian Rivers Institute, Griffith University, Nathan, QLD, 4111, Australia

Popular version of paper 1pAB1
Presented Monday afternoon (1:00-1:20 pm), November 5, 2018
176th ASA Meeting, Victoria, Canada

Healthy freshwater environments are essential to the survival of many living organisms including humans. Disturbingly, these environments are so impacted by human activity that biodiversity is declining faster in rivers and lakes than any other type of environment: between 1970 and 2012 populations declined by 81% in freshwater systems compared with 38% and 36% for terrestrial and marine systems respectively (WWF, 2016). Action must be taken to protect these environments, and for this efficient monitoring of ecosystem condition is crucial.

There are several sources of sounds that can be heard underwater in lakes and rivers. Many animals communicate through sound, including frogs, fish (Fig. 1), insects (Fig. 2) and some crustaceans. Water flow and pebbles rolling at the bottom of rivers and streams can be very informative about the physical structure of the environment. The most surprising source of sound may be that of breathing and photosynthesizing plants (Fig. 3).

Figure 1: Video of a pool with spangled grunters (Leiopotherapon unicolor) and juvenile sooty grunters (Hephaestus fuliginosus). Both species are emitting grunts. Recorded in Talaroo (Queensland, Australia).

Effective restoration and protection actions requires detailed knowledge of the environments. It is therefore necessary to survey and monitor freshwater environments. Most current methods used to survey freshwater environments such as netting and electrofishing suffer some limitations: (i) they can injure wildlife, (ii) they only provide a snapshots of the environment, and (iii) they can require a significant workforce. In this presentation, we propose that using sounds recorded underwater with hydrophones is a powerful method to survey freshwater environments.

(Cdesjonqueres_fig2.png and Cdesjonqueres_fig2.wav)

Figure 2: Spectrogram and associated recording of a true bug (Hemiptera) chorus recorded at night in Talaroo (Queensland, Autralia).

The use of sounds recorded in the environment for ecological surveys is studied in the field of ecoacoustics. Ecoacoustic monitoring relies on non-invasive methods that only require the introduction of an acoustic sensor in the environment. Automatic recorders allow for continuous monitoring and reduces the amount of workforce required. Freshwater ecoacoustic monitoring therefore seems like a great complement to more typical surveying methods.

Figure 3: Video of a plant expelling gas bubbles underwater and associated hydrophone recording (Video courtesy of François Vaillant). The legend in the video at 4 seconds reads ‘little bubbles coming out of the leaf’ and at 30 seconds says ‘a ‘big’ bubble is forming at the surface of the leaf’.

Ecoacoustic monitoring is an extremely promising method, already used in terrestrial and marine environments, but that is yet to be operationalized in freshwater environments. Our current research aims at standardizing temporal and spatial sampling designs as well as investigating the links between acoustic and habitat condition in freshwater environments. Overcoming those challenges will allow the application of ecoacoustic monitoring to a broad range of conservation and ecological research questions including the detection of rare or invasive species as well as condition surveys (e.g. polluted vs pristine) or rapid biodiversity assessments.

References:
WWF (2016) Living Planet Report 2016: Risk and Resilience in a New Era. WWF international, Gland, Switzderland.

4aNS11 – Lombard Effect In Restaurant Setting: How Much Would You Spend To Eat At This Restaurant?

Pasquale Bottalico – pb81@illinois.edu

University of Illinois – Department of Speech and Hearing Science
901 South 6th Street
Champaign, IL 61820

Popular version of paper 4aNS11, “Lombard Effect In Restaurant Setting: How Much Would You Spend To Eat At This Restaurant?”
Presented Thursday morning, November 8, 2018, 11:40-12:00 AM, SALON C (VCC)
Joint Meeting 176th ASA Meeting and 2018 Acoustics Week in Canada (CAA), Victoria BC, Canada

This study was conducted to determine the exact point when the noise in a restaurant setting causes vocal discomfort for customers. Another aim of the study was to identify customers’ willingness to spend time and money in a restaurant depending on the varying noise level in the environment.

According to the 2016 Zagat State of American Dining report, 25 percent of restaurant customers consider noise the most irritating component of dining out (Figure 1).

Figure 1. Results from the 2016 National Dining Trends survey of Zagat

The Lombard effect is when speakers unconsciously increase the loudness level of their speech in the presence of background noise in order to be understood. This requires increased vocal effort and can cause vocal fatigue over time. In a restaurant setting particularly, background noise created by other patrons’ conversations is more likely to trigger the Lombard effect than other types of background noise [1] (Figure 2). Previous studies have demonstrated that uncomfortably loud levels of background noise can result in decreased customer satisfaction and business for the restaurant [2, 3].

Figure 2. Example of a noisy restaurant

The Lombard effect has been investigated in a variety of environmental settings with different types and levels of background noise.  However, little is known about the level of background noise that will cause the Lombard effects in restaurant settings.

Fourteen male and 14 female college students with normal hearing were recruited to participate in the study. They read passages to a listener in the presence of typical restaurant noise (as in the attached audio clip) with the level varying between 35 dBA and 85 dBA. Participants were instructed to be sure that the listener could understand them equally well in each condition. (Figure 3)

Lombard Effect

Figure 3. Experimental setup


Restaurant noise

For each noise condition, the participants were then instructed to answer questions about the disturbance they perceived from the noise, how long they would enjoy spending time in this restaurant setting, and how much money they would spend at this restaurant.

The results showed that both participant vocal effort and disturbance increased as the background noise level increased. Reported willingness to spend time and money at a restaurant decreased as the background noise level increased. The participants started to be disturbed at noise levels higher than 52.2 dB(A) (Figure 4, blue line). Because of the disturbance in the communication, participant vocal effort increased at a doubled rate as the background noise level increased (Figure 4, red line) for noise levels higher 57.3 dB(A) (approximately the level of normal conversational speech). Similar noise levels to the one that starts the communication disturbance (51.3 dB(A) and 52.5 dB(A)) also trigger a decrease in the willingness to spend time and money in a restaurant (Figure 4, green and yellow lines). In conclusion, to improve the acoustic environment of restaurants, background noise levels should be lower than 50-55 dB(A). This will minimize the vocal effort of patrons and the disturbance in their communication. Concurrently, this will increase business for the restaurant since patrons would be willing to spend more time and money to eat in a restaurant with a background noise lower than 50-55 dB(A).

Figure 4. Relationship between the level of the noise in dB(A) and self-reported communication disturbance (blue line), relative voice level (red line), willingness to spend time (green line) and willingness to spend money (yellow line), where the error bands indicate the standard error. Vertical dashed lines mark the change-points.

Bibliography
[1]A. Astolfi and M. Filippi, “Good acoustical quality in restaurants: a comparison between speech intelligibility and privacy,” in Proceedings of EuroNoise (2003).

[2] C. C. Novak, J. La Lopa, and R. E. Novak, “Effects of sound pressure levels and sensitivity to noise on mood and behavioral intent in a controlled fine dining restaurant environment,” Journal of Culinary Science & Technology 8(4), 191-218 (2010).

[3] W. O. Olsen, “Average speech levels and spectra in various speaking/listening conditions: A summary of the Pearson, Bennett, & Fidell (1977) report,” American Journal of Audiology 7(2), 21-25 (1998).

1aSP2 – Propagation effects on acoustic particle velocity sensing

Sandra L. Collier – sandra.l.collier4.civ@mail.mil, Max F. Denis, David A. Ligon, Latasha I. Solomon, John M. Noble, W.C. Kirkpatrick Alberts, II, Leng K. Sim, Christian G. Reiff, Deryck D. James
U.S. Army Research Laboratory
2800 Powder Mill Rd
Adelphi, MD 20783-1138

Madeline M. Erikson
U.S. Military Academy
West Point, NY

Popular version of paper 1aSP2, “Propagation effects on acoustic particle velocity sensing”
Presented Monday morning, 7 May 2018, 9:20-9:40 AM, Greenway H/I
175th ASA Meeting Minneapolis, MN

Left: time series of the recorded particle velocity amplitude versus time for propane cannon shots. Right: corresponding spectrogram. Upper: 100 m; lower 400 m.

As a sound wave travels through the atmosphere, it may scatter from atmospheric turbulence. Energy is lost from the forward moving wave, and the once smooth wavefront may have tiny ripples in it if there is weak scattering, or large distortions if there is strong scattering. A significant amount of research has studied the effects of atmospheric turbulence on the sound wave’s pressure field. Past studies of the pressure field have found that strong scattering occurs when there are large turbulence fluctuations and/or the propagation range is long, both with respect to wavelength. This scattering regime is referred to as fully saturated. In the unsaturated regime, there is weak scattering and the atmospheric turbulence fluctuations and/or propagation distance are small with respect to the wavelength. The transition between the two regimes is referred to as partially saturated.

Usually, when people think of a sound wave, they think of the pressure field, after all, human ears are sophisticated pressure sensors. Microphones are pressure sensors. But a sound wave is a mechanical wave described not only by its pressure field, but also by its particle velocity. The objective of our research is to examine the effects of atmospheric turbulence on the particle velocity. Particle velocity sensors (sometimes referred to as vector sensors) in the air are relatively new, and as such, atmospheric turbulence studies have not been conducted before. We do this statistically, as the atmosphere is a random medium.  This means that every time a sound wave propagates, there may be a different outcome – a different path, a change in phase, a change in amplitude. The probability distribution function describes the set of possible outcomes.

The cover picture illustrates a typical transient broadband event (propane cannon) recorded 100 m (upper plots) away from the source. The time series on the left is the recorded particle velocity versus time. The spectrogram on the right is a visualization of the frequency and intensity of the wave through time. The sharp vertical lines across all frequencies are the propane cannon shots. We also see other noise sources: a passing airplane (between 0 and 0.5 minutes) and noise from power lines (horizontal lines). The same shots recorded at the 400 m are shown in the lower plots. We notice right away there are the numerous vertical lines – most probably due to wind noise. Since the sensor is further away, the amplitude of the sound is reduced, the higher frequencies have attenuated, and the signal-to-noise ratio is lower.

The atmospheric conditions (low wind speeds, warm temperatures) led to convectively driven turbulence described by a von Kármán spectrum. Statistically, we found that the particle velocity had similar probability distributions to previous observations of the pressure field with similar atmospheric conditions: unsaturated regime is observed for lower frequencies and shorter ranges; and the saturated regime is observed for higher frequencies and longer ranges. In the figure below (left), the unsaturated regime is seen as a tight collection of points, with little variation in phase (angle along the circle) or amplitude (distance from the center). The beginning of the transition into the partially saturated regime has very little amplitude fluctuations and small phase fluctuations, and the set of observations has the shape of a comma (middle). The saturated regime is when there are large variations in the amplitude and phase, and the set of observations appears to be fully randomized – points everywhere (right).

Scatter plots of the particle velocity for observations over two days (blue – day 1; green – day 2).  From left to right, the scatter plots depict the unsaturated regime, partially saturated regime, and saturated regime.

The propagation environment has numerous other states that we also need to study to have a more complete picture. It is standard practice to benchmark the performance of different microphones, so as to determine sensor limitations and optimal operating conditions.  Similar studies should be done for vector field sensors once new instrumentation is available.  Vector sensors are of importance to the U.S. Army for the detection, localization, and tracking of potential threats in order to provide situational understanding and potentially life-saving technology to our soldiers. The particle velocity sensor we used was just bigger than a pencil. Including the windscreen, it was about a foot in diameter. Compare that to a microphone array that could be meters in size to accomplish the same thing.

Bibliography

  1. Cheinet, M. Cosnefroy, D.K. Wilson, V.E. Ostashev, S.L. Collier and J.E. Cain, “Effets de la turbulence sur des impulsions acoustiques propageant près du sol (Effects of turbulence on acoustic impulses propagating near the ground),” Congrès Français d’Acoustique (French Congress of Acoustics), 11-15 April 2016, Le Mans, France.
  2. Ehrhardt, S. Cheinet, D. Juvé and P. Blanc-Benon, “Evaluating a linearized Euler equations model for strong turbulence effects on sound propagation,” J. Acoust. Soc. Am., 133, 1922-1933 (2013).
  3. L. Collier, “Fisher Information for a Complex Gaussian Random Variable: Beamforming Applications for Wave Propagation in a Random Medium,” IEEE Trans. Sig. Proc. 53, 4236-4248 (2005).
  4. E. Norris, D.K. Wilson and D.W. Thomson, “Correlations Between Acoustic Travel-Time Fluctuations and Turbulence in the Atmospheric Surface Layer,” Acta Acust. Acust., 87, 677-684 (2001).

Acknowledgement:
This research was supported in part by an appointment to the U.S. Army Research Laboratory
Research Associateship Program administered by Oak Ridge Associated Universities.