1pSC12 – Is it blow or below? How well can second-language learners distinguish between words that differ in syllable count?

Keiichi Tajima – tajima@hosei.ac.jp
Dept. of Psychology
Hosei University
2-17-1 Fujimi, Chiyoda-ku
Tokyo 102-8160
Japan

Stefanie Shattuck-Hufnagel – sshuf@mit.edu
Research Laboratory of Electronics
Massachusetts Institute of Technology
77 Massachusetts Avenue
Cambridge, MA 02139
USA

Popular version of paper 1pSC12
Presented Sunday afternoon, June 25, 2017
173rd ASA Meeting, Boston

Learning pronunciation and listening skills in a second language is a challenging task.  Languages vary not only in the vowels and consonants that are used, but also in how the vowels and consonants combine to form syllables and words. For example, syllables in Japanese are relatively simple, often consisting of just a consonant plus a vowel, but syllables in English tend to be more complex, containing several consonants in a row. Because of these differences, learning the syllable structure of a second language may be difficult.

For example, when Japanese learners of English pronounce English words such as “stress,” they often pronounce it as “sutoresu,” inserting what are called epenthetic vowels (underlined) between adjacent consonants and at the end of words [1]. Similarly, when asked to count the number of syllables in spoken English words, Japanese learners often over-estimate the number of syllables, saying, for example, that the one-syllable word, play, contains 2 syllables [2].

This may be because Japanese listeners “hear” an epenthetic vowel between adjacent consonants even if no vowel is physically present. That is, they may hear “play” as something like “puh-lay,” thus reporting to have heard two syllables in the word. In fact, a study has shown that when Japanese speakers are presented with a nonsense word like “ebzo,” they report hearing an “illusory” epenthetic vowel between the b and z; that is, they report hearing “ebuzo” rather than “ebzo,” even though the vowel u was not in the speech signal [3].

These tendencies suggest the possibility that Japanese learners may have difficulty distinguishing between English words that differ in syllable count, or the presence or absence of a vowel, e.g. blow vs. below, sport vs. support.  Furthermore, if listeners tend to an extra vowel between consonants, then they might be expected to misperceive blow as below more often than below as blow.

To test these predictions, we conducted a listening experiment with 42 Japanese learners of English as participants. The stimuli consisted of 76 pairs of English words that differed in the presence or absence of a vowel. Each pair had a “CC word” that contained a consonant-consonant sequence, like blow, and a “CVC word” that had a vowel within that sequence, like below. On each trial, listeners saw one pair of words on the computer screen, and heard one of them through headphones, as pronounced by a male native English speaker. The participants’ task was to pick which word they think they heard by clicking on the appropriate button. A control group of 14 native English participants also took part in the experiment.

Figure 1 shows the percentage of correct responses for CC words and CVC words for the Japanese learners of English (left half) and for the native English listeners (right half). The right half of Figure 1 clearly shows that the native listeners were very good at identifying the words; they were correct about 98% of the time.  In contrast, the left half of Figure 1 shows that the Japanese listeners were less accurate; they were correct about 75~85% of the time.  Interestingly, their accuracy was higher for CC words (85.7%) than for CVC words (73.4%), contrary to the prediction based on vowel epenthesis.
syllable
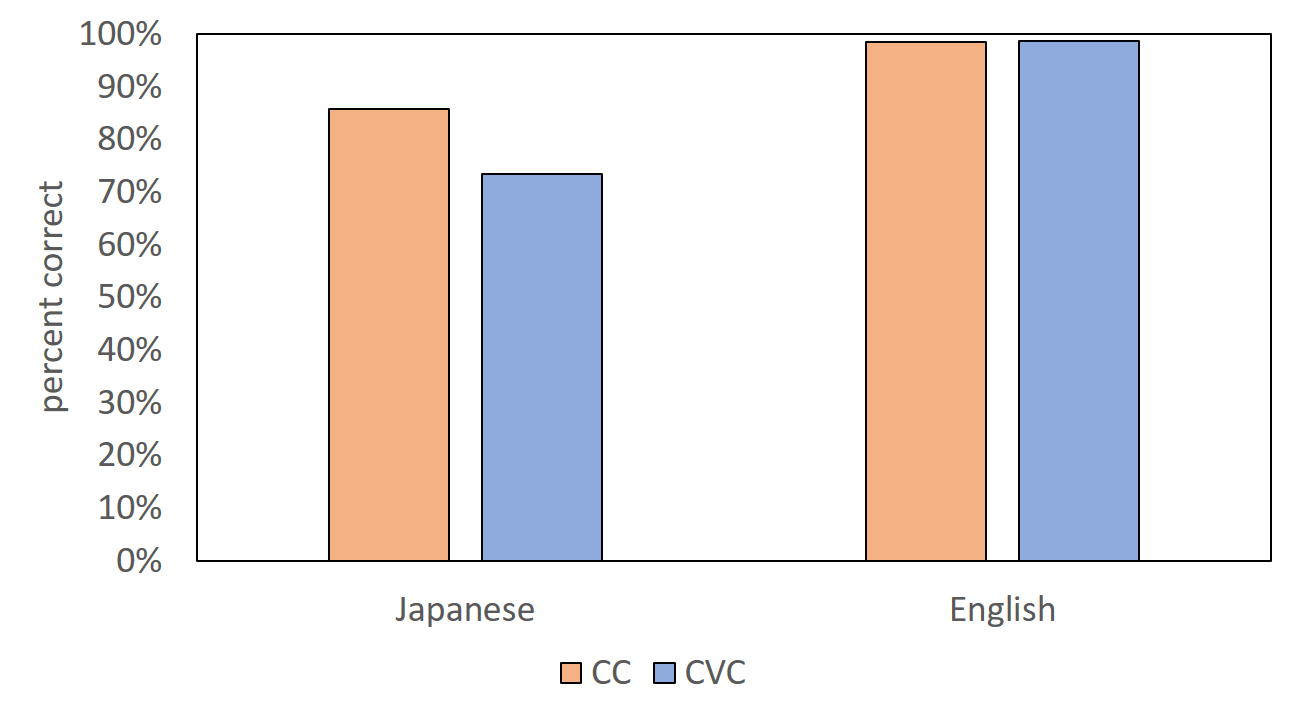
Figure 1. Percent correct identification rate for CC words, e.g. blow, and CVC words, e.g. below, for Japanese learners of English (left half) and native English listeners (right half). Credit: Tajima/ Shattuck-Hufnagel

To find out why Japanese listeners’ performance was lower for CVC words than for CC words, we further analyzed the data based on phonetic properties of the target words. It turned out that Japanese listeners’ performance was especially poor when the target word contained a particular type of sound, namely, a liquid consonant such as “l” and “r”. Figure 2 shows Japanese listeners’ identification accuracy for target words that contained a liquid consonant (left half), like blow-below, prayed-parade, scalp-scallop, course-chorus, and for target words that did not contain a liquid consonant (right half), like ticked-ticket, camps-campus, sport-support, mint-minute.

The left half of Figure 2 shows that while Japanese listeners’ accuracy for CC words that contained a liquid consonant, like blow, prayed, was about 85%, their accuracy for the CVC counterparts, e.g. below, parade, was about 51%, which is at chance (guessing) level. In contrast, the right half of Figure 2 shows that Japanese listeners’ performance on words that did not contain a liquid sound was around 85%, with virtually no difference between CC and CVC words.
syllable
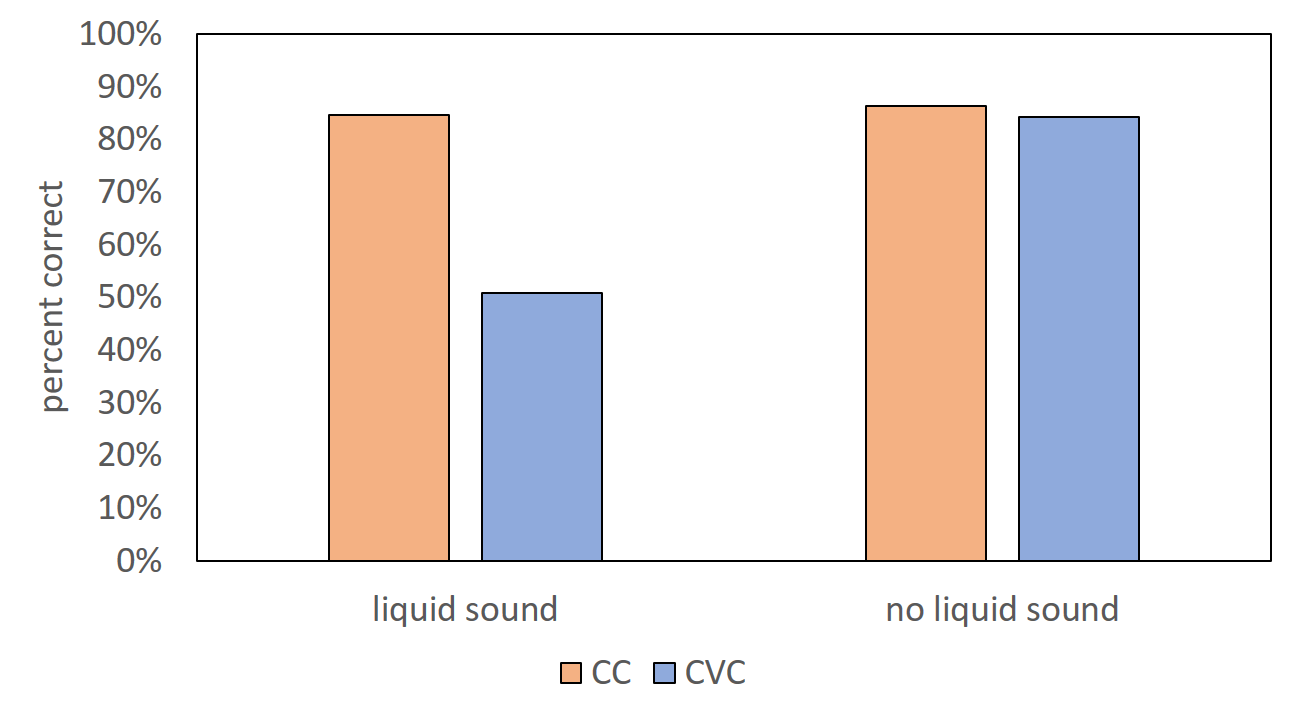
Figure 2. Percent correct identification rate for word pairs that contained a liquid consonant, e.g. blow-below, prayed-parade (left half) and word pairs that did not contain a liquid consonant, e.g. ticked-ticket, camp-campus. Credit: Tajima/ Shattuck-Hufnagel

Why was Japanese listeners’ performance poor for words that contained a liquid consonant? One possible explanation is that liquid consonants are acoustically similar to vowel sounds. Compared to other kinds of consonants such as stops, fricatives, and nasals, liquid consonants generally have greater intensity, making them similar to vowels. Liquid consonants also generally have a clear formant structure similar to vowels, i.e. bands of salient energy stemming from resonant properties of the oral cavity.

Because of these similarities, liquid consonants are more confusable with vowels than are other consonant types, and this may have led some listeners to interpret words with vowel + liquid sequences such as below and parade as containing just a liquid consonant without a preceding vowel, thus leading them to misperceive the words as blow and prayed. Given that the first vowel in words such as below and parade is a weak, unstressed vowel, which is short and relatively low in intensity, such misperceptions would be all the more likely.

Another possible explanation for why Japanese listeners were poorer with CVC words than CC word may have to do with the listeners’ familiarity with the target words and their pronunciation.  That is, listeners may have felt reluctant to select words which they were not familiar with or did not know how to pronounce. When the Japanese listeners were asked to rate their subjective familiarity with each of the English words used in this study using a 7-point scale, from 1 (not familiar at all) to 7 (very familiar), it turned out that their ratings were higher on average for CC words (4.8) than for CVC words (4.1).

Furthermore, identification accuracy showed a moderate positive correlation (r = 0.45) with familiarity rating, indicating that words that were more familiar to Japanese listeners tended to be more correctly identified. These results suggest that listeners’ performance in the identification task was partly affected by how familiar they were with the English words.

Put together, the present study suggests that Japanese learners of English indeed have difficulty correctly identifying spoken English words that are distinguished by the presence vs. absence of a vowel. From a theoretical standpoint, the results are intriguing because they are not in accord with predictions based on vowel epenthesis, and suggests that detailed properties of the target words affect the results in subtle ways. From a practical standpoint, the results suggest that it would be worthwhile to develop ways to improve learners’ skills in listening to these distinctions.

References

  • Tajima, K., Erickson, D., and Nagao, K. (2003). Production of syllable structure in a second language: Factors affecting vowel epenthesis in Japanese-accented English. In Burleson, D., Dillon, C., and Port, R. (eds.), Indiana University Working Papers in Linguistics 4, Speech Prosody and Timing: Dynamic Aspects of Speech. IULC Publications.
  • Tajima, K. (2004). Stimuus-related effects on the perception of syllables in second-language speech. Bulletin of the Faculty of Letters, vol. 49, Hosei University.
  • Dupoux, E., Kakehi, K., Hirose, Y., Pallier, C., and Mehler, J. (1999). Epenthetic vowels in Japanese: A perceptual illusion? Journal of Experimental Psychology: Human Perception and Performance, 25, 1568-1578.

1aAAa2 – Can humans use echolocation to hear the difference between different kinds of walls?

David Pelegrin Garcia – david.pelegringarcia@kuleuven.be
KU Leuven, Dept. Electrical Engineering
Kasteelpark Arenberg 10 – box 2446
3001 Leuven, Belgium

Monika Rychtarikova – monika.rychtarikova@kuleuven.be
KU Leuven, Faculty of Architecture
Hoogstraat 51
9000 Gent, Belgium

Lukaš Zelem – lukas.zelem@stuba.sk
Vojtech Chmelík – vojtech.chmelik@stuba.sk
STU Bratislava, Dept. Civil Engineering
Radlinského 11
811 07 Bratislava, Slovakia

Leopold Kritly – leopold.kritly@gmail.com
Christ Glorieux – christ.glorieux@kuleuven.be
KU Leuven, Dept. Physics and Astronomy
Celestijnenlaan 200d – box 2416
3001 Leuven, Belgium

Popular version of 1aAAa2 Auditory recognition of surface texture with various scattering coefficients
Presented Sunday morning, June 25, 2017 173rd ASA Meeting, Boston
Click here to read the abstract

When we switch on the light in a room, we see objects. As a matter of fact, we see the reflection of light from these objects, revealing their shape and color. This all seems to happen instantaneously since, due the enormously high speed of light, the time that light needs to travel from the light source to the object then to our eye is extremely short. But how is it with sound? Can we “hear objects”, or correctly said, sound reflections from objects? In other words, can we “echolocate”?

We know that sound, in comparison to light, propagates much slower. Therefore, if we stand far enough from a large obstacle and clap our hands, shortly after hearing the initial clapping sound, we hear a clear sound reflection from objects – an echo (Figure 1). But is it possible to detect an object if we stand close to it? And can the shape or surface texture of an object be recognized from the “color” of the sound? And how does it work?

human echolocation

Figure 1. Sound arriving at the ears after emitting a ‘tongue click’ in the presence of an obstacle. Credit: Pelegrin-Garcia/KU Leuven

It is widely known that bats, dolphins and other animals use echolocation to orient themselves in their environment and detect obstacles, preys, relatives or antagonists. It is less known that, with some practice, most people are also able to echolocate. As a matter of fact, echolocation makes a great difference in the lives of blind people who use it in their daily lives [1, 2], and are commonly referred to as “echolocators.”

While echolocation is mainly used as an effective means of orientation and mobility, additional information can be extracted from listening to reflected sound. For example, features about objects’ texture, size and shape can be deduced, and a meaning can be assigned to what is heard, such as. a tree, car or a fence. Furthermore, echolocators form a “map” of their surroundings by inferring where objects stand in relation to their body, and how different objects related to each other.

In our research, we focus on some of the most elementary auditory tasks that are required during echolocation: When is a sound reflection audible? Can people differentiate among sound reflections returned by objects with different shapes, fabric or surface textures?

In previous work [3] we showed that by producing click-sounds with their tongue, most sighted people without prior echolocation experience were able to detect reflections from large walls at distances as far as 16 meters in ideal conditions, such as in open field where there are no obstacles other than the wall that reflects the sound, and where one cannot hear any other noises like background noise. Blind echolocators in a similar study [4], nevertheless, could detect reflections from much smaller objects at nearby distances below 2 meters.

In the present study, we investigated whether sighted people who had no experience with echolocation could distinguish between walls with different surface textures by just listening to a click reflected by the wall.

To answer this question, we performed listening tests with 16 sighted participants. We played back a pair of clicks with an added reflection; the first click with one kind of wall and the second with another. Participants responded as to whether they heard a difference between the two clicks or not. This was repeated at distances of 1.5 meters and 10 meters for all possible pairs of simulated walls with various geometries (see in Figure 2 some of these walls and the echoes they produced).

human echolocation

Figure 2. Sample of the wall geometries that we tested (from left to right, top row: staircase, parabolic (cave-like) wall, sinusoid wall and periodic squared wall; bottom row: narrow wall with an aperture, broad wall, narrow wall, convex circular wall), with the echoes they produced at distances of 1.5 and 10 m. Credit: Pelegrin-Garcia/KU Leuven

We found that most participants could distinguish the parabolic wall and the staircase from the rest of the walls at a distance of 10 meters. The parabolic (cave-like) wall returned much stronger reflections than all other walls due to acoustic focusing. The sound emitted in different directions was reflected back by the wall to the point of emission. On the other hand, the staircase returned a reflection with a “chirp” sound. This kind of sound was also the focus of study at the Kukulcan temple in Mexico [5].

The results of our work support the hypothesis of a recent investigation [6] that suggests that prehistoric societies could have used echolocation to select the placement of rock art in particular caves that returned clearly distinct echoes at long distances.


[1] World Access for the Blind, “Our Vision is Sound”, https://waftb.org. Retreived 9th June 2017

[2] Thaler, L. (2013). Echolocation may have real-life advantages for blind people: An analysis of survey data. Frontiers in Physiology, 4(98). http://doi.org/10.3389/fphys.2013.00098

[3] Pelegrín-García, D., Rychtáriková, M., & Glorieux, C. (2017). Single simulated reflection audibility thresholds for oral sounds in untrained sighted people. Acta Acustica United with Acustica, 103, 492–505. http://doi.org/10.3813/AAA.919078

[4] Rice, C. E., Feinstein, S. H., & Schusterman, R. J. (1965). Echo-Detection Ability of the Blind: Size and Distance Factors. Journal of Experimental Psychology, 70(3), 246–255.

[5] Trivedi, B. P. (2002). Was Maya Pyramid Designed to Chirp Like a Bird? National Geographic News (http://news.nationalgeographic.com/news/2002/12/1206_021206_TVMayanTemple.html). Retrieved 10th June 2017

[6] Mattioli, T., Farina, A., Armelloni, E., Hameau, P., & Díaz-Andreu, M. (2017). Echoing landscapes: Echolocation and the placement of rock art in the Central Mediterranean. Journal of Archaeological Science, 83, 12–25. http://doi.org/10.1016/j.jas.2017.04.008

How Can MRI Contribute to Cleft Palate Care?

Jamie Perry perryja@ecu.edu

East Carolina University

College of Allied Health Sciences
Dept. of Communication Sciences and Disorders
East Carolina University
Greenville, NC 27834
(252) 744-6144

Presented Monday morning, June 26th, 2017
As part of a speaker panel session, “New trends in visualizing speech production”
173rd ASA Meeting, Boston

Cleft lip and palate is the most prevalent birth defect in the United States. Despite advances in surgery, 25-37% of children with a repaired cleft palate continue to have nasal sounding speech and require multiple surgeries (Bicknell et al., 2002; Lithovius et al., 2013). This relatively high failure rate has remained unchanged over the past 15 years.

A critical barrier to understanding surgical outcomes and decreasing failure rates is the lack of imaging studies that can be used on young children to understand the underlying anatomy. Current imaging techniques used to study cleft palate speech use either radiation (e.g., x-ray or computed tomography), or are considered invasive (e.g., nasopharyngoscopy). None of these traditional imaging methods provide a view of the primary muscles needed to have normal sounding resonance.

Our research laboratory from East Carolina University (Greenville, NC) has been working with a team, including Bradley Sutton and David Kuehn at the University of Illinois at Urbana-Champaign, to establish an imaging tool that can be used to examine the underlying anatomy in a child with cleft palate.

With the support of a team of experts in cleft palate and bioimaging, we described a method for obtaining dynamic magnetic resonance images (MRI) of children during speech. Using dynamic MRI, we are now able to view the muscles inside the speech mechanism. Figure 1 shows images along the sequence of the dynamic images. Images are obtained at 120 frames per second and allow investigators to study a three-dimensional dataset while simultaneously capturing speech recordings (Fu et al., 2015, Fu et al., 2017). With a leading expert in computational modeling from the University of Virginia, Silvia Blemker, we have been able to build a model that can simulate the anatomy in cleft palate. We are then able to study how surgical techniques impact speech.

MRI

Fig. 1

Specifically, we used computational modeling (Inouye et al., 2015) to simulate function of the mechanism for producing normal resonance, called the velopharyngeal mechanism. In 2015, Inouye and colleagues used this computational model to predict how much levator veli palatini muscle overlap is needed to produce normal function.

Using these and other types of computational models, we can predict outcomes based on surgery techniques. Through these series of investigations, we are able to advance our understanding of speech in children with cleft palate and to find ways to improve surgical outcomes.


References

Bicknell S, McFadden LR, Curran JB. Frequency of pharyngoplasty after primary repair of cleft palate. J Can Dent Assoc. 2002;68(11):688-692.

Fu M, Barlaz MS, Holtrop JL, Perry JL, Kuehn DP, Shosted RK, Liang Z, Sutton BP. High-resolution full-vocal-tract 3D dynamic speech imaging. Magn Reson Med. 2017;77:1619-1629. Doi: 10.1002/mrm.26248. PMID: 27099178.

Fu M, Bo Z, Shosted RK, Perry JL, Kuehn DP, Liang Z, Sutton BP. High-resolution dynamic speech imaging with joint low-rank and sparsity constraints. Magn Reson Med. 2015;73:1820-1832.

Inouye JM, Perry JL, Pelland CM, Lin KY, Borowitz KC, Blemker SS (2015). A computational model quantifies the effect of anatomical parameters on velopharyngeal function. J Speech Lang Hear Res. 58;1119: doi: 10.1044

Lithovius RH, Ylikontiola LP, Sandor GK. Frequency of pharyngoplasty after primary repair of cleft palate in northern finland. Oral Surg Oral Med Oral Pathol Oral Radiol. 2014;117(4):430-434. doi: 10.1016/j.oooo.2013.12.409.

2pAO6 – Ocean tides are conductors of underwater icy concerts

Oskar Glowacki – oglowacki@igf.edu.pl
Institute of Geophysics, Polish Academy of Sciences
Ksiecia Janusza 64
01-452 Warsaw, Poland

Popular version of paper 2pAO6 “An acoustic study of sea ice behavior in a shallow, Arctic bay”
Presented Monday afternoon, June 26, 2017
Session in Honor of David Farmer
173rd ASA Meeting, Boston

Glacial bays are extremely noisy marine environments, mainly because of the melting of marine terminating glaciers [1-3]. Tiny air bubbles bursting explosively from the ice during contact with warm ocean waters are responsible for these signatures. One of the most noisy and spectacular phenomena are also detachments of large icebergs at the ice-ocean boundary, called glacier calving events [4-5].

Both processes are particularly active during warm conditions in the Arctic summer and early autumn. When the air temperature drops, the water cools down and after some time a thin layer of sea-ice appears. But even then, the underwater environment is not always a quiet place. Researchers found it a few decades ago during field measurements far in the north.

A large number of acoustical studies concerning sea-ice processes appeared in the 1960s. Results from field campaigns clearly showed that underwater noise levels recorded below the ice depend strongly on environmental conditions and the structure of ice itself. For example, sea-ice cover cracks during abrupt decrease in air temperature and deforms under the influence of wind action and ocean currents [6-8].

The noise levels measured in winter were often similar to those observed at open sea with wave heights reaching up to 1.25 meters [6]. Conversely, when the ice is strongly consolidated and thick enough, recorded noise levels can be much lower than those typically observed during completely calm conditions [9]. However, most of these findings based on acoustic recordings carried out very far away from the ocean shore. The question is: Should we even care about sea-ice conditions in much shallower regions, like small Arctic bays?

Now, we are all experiencing climate shifts that lead to disappearance of sea-ice. Without ice formed close to the shores, coastlines are directly exposed to the destructive action of ocean waves [10]. This, in turn, poses a serious threat to settlements and infrastructure. It is therefore important to monitor sea-ice evolution in shallow areas, including both the degree of consolidation and phases of transformation.

I am addressing these questions by showing the results of several experiments, conducted in Hornsund Fjord, Spitsbergen, in order to find acoustical characteristics of different types of ice. Sea-ice was present in various forms during the whole field campaign, from a thin layer through rounded chunks (pancake ice) and finally consolidated ice cover (Fig. 1).

Fig. 1. Different forms of sea-ice have different sound signatures. A photograph taken at the study site, in Hornsund Fjord, Spitsbergen, close to the Polish Polar Station.

Recorded underwater noise levels changed periodically together with a tidal cycle. For consolidated ice cover, the highest noise levels occurred suddenly at low water, when underwater rocks are crushing the ice (Mov. 1; Rec. 1). Another scenario takes place for relatively thick ice pancakes. They are packed together when the water is low, but the spaces between them begin to grow during the high tide. With additional wind or current stress, chunks of ice can easily collide and thus produce low-frequency, transient noise (Rec. 2). Finally, for thinner pancakes or freshly formed ice cover, we can hear the loudest sounds when the water is going down. Chunks of mechanically weak ice are squeezed together, leading to deformations and consequently highest underwater noise levels at low frequencies (Fig. 2; Rec. 3). In some cases, stresses acting on ice are not crushing it, but produce sounds resemble a creaking door (Rec. 4).

The results prove that different types of sea-ice react differently for tidal movement, and we captured these differences by acoustic recorders. This relationship can be used for long-term studies of sea-ice conditions in the shallow Arctic bays. The environments, where ocean tides serve as a conductor in the underwater icy concerts.

Fig. 2. Noise levels at low frequencies are much higher when the water is going down (see red frames). Mechanically weak sea-ice cover is squeezed and leads to large deformations and break-up events. The upper plot presents a spectrogram of the acoustic recording lasting more than 15 hours. Brighter color indicates higher noise levels. Time is on the horizontal axis, and frequency in logarithmic scale is on the vertical axis. A value of 3 is a frequency of 1000 Hz, while 2 equates to 100 Hz. The lower plot presents modeled data, corresponding tidal cycle (water level change) for the study site.

Mov. 1. Ocean tides lead to huge deformations and break-up of the sea-ice cover. Time-lapse video from Isbjornhamna Bay, Hornsund Fjord, Spitsbergen.

Rec. 1. The sound of sea-ice brake-up caused by underwater rocks during low water.

Rec. 2. Transient noise of colliding chunks of ice during high water.

Rec. 3. The sound of deforming ice, which is squeezed when the water is going down.

Rec. 4. Sometimes sea-ice processes sound like a creaking door.

The work was funded by the Polish National Science Centre, grant No. 2013/11/N/ST10/01729.

[1] Tegowski, J., G. B. Deane, A. Lisimenka, and P. Blondel, Detecting and analyzing underwater ambient noise of glaciers on Svalbard as indicator of dynamic processes in the Arctic, in Proceedings of the 4th UAM Conference, 2011: p. 1149–1154, Kos, Greece.

[2] Pettit, E. C., K. M. Lee, J. P. Brann, J. A. Nystuen, P. S. Wilson, and S. O’Neel, Unusually loud ambient noise in tidewater glacier fjords: A signal of ice melt, Geophys. Res. Lett., 2015. 42(7): p. 2309–2316.

[3] Deane, G. B., O. Glowacki, J. Tegowski, M. Moskalik, and P. Blondel, Directionality of the ambient noise field in an Arctic, glacial bay, J. Acoust. Soc. Am., 2014. 136(5), EL350.

[4] Pettit, E. C., Passive underwater acoustic evolution of a calving event, Ann. Glaciol., 2012. 53: p. 113–122.

[5] Glowacki, O., G. B. Deane, M. Moskalik, P. Blondel, J. Tegowski, and M. Blaszczyk, Underwater acoustic signatures of glacier calving, Geophys. Res. Lett., 2015. 42(3): p. 804–812.

[6] Milne, A. R., and J. H. Ganton, Ambient Noise under Arctic-Sea Ice, J. Acoust. Soc. Am., 1964. 36(5): p. 855-863.

[7] Ganton, J. H., and A. R. Milne, Temperature- and Wind-Dependent Ambient Noise under Midwinter Pack Ice, J. Acoust. Soc. Am., 1965. 38(3): p. 406-411.

[8] Milne, A. R., J. H. Ganton, and D. J. McMillin, Ambient Noise under Sea Ice and Further Measurements of Wind and Temperature Dependence, , J. Acoust. Soc. Am., 1966. 41(2): p. 525-528.

[9] Macpherson, J. D., Some Under-Ice Acoustic Ambient Noise Measurements, J. Acoust. Soc. Am., 1962. 34(8): p. 1149-1150.

[10] Barnhart, K. R., I. Overeem, and R. S. Anderson, The effect of changing sea ice on the physical vulnerability of Arctic coasts, The Cryosphere, 2014. 8: p. 1777-1799.

2pAAb1 – The acoustics of rooms for music rehearsal and performance: The Norwegian approach

Jon G. Olsen – jon.olsen@musikk.no
Council for Music Organizations in Norway, Oslo, Norway

Jens Holger Rindel – jens.holger.rindel@multiconsult.no
Multiconsult, Oslo, Norway

Popular version of 2pAAb1, “The acoustics of rooms for music rehearsal and performance – the Norwegian approach”
Presented Monday afternoon, June 26, 2017, 1:20 pm.
173rd ASA Meeting / 8th Forum Acusticum, Boston, USA
Click here to read the abstract

Each week, local music groups in Norway use more than 10,000 rooms for rehearsals and concerts. Over 500,000 people sing, play or go to concerts every week. In Europe, over 40 million choir singers spend at least one evening in a rehearsal room. Professional musicians and singers use rehearsal rooms many hours a day. Most of the local concerts take place in rooms that are not designed for concert events, but are in schools, community centers, youth clubs and other rooms and spaces more or less suitable for playing music.

The size of the rooms varies from under 100 to over 10, 000 cubic meters. The users cover a broad variety of music ensembles, mostly wind bands, choirs and other amateur ensembles. Since 2009, the Norwegian Council for Music Organizations (Norsk musikkråd) has completed more than 600 acoustical room measurement reports on rooms used for rehearsal and concerts. All the reports are made available online with a Google Map of Norway (http://database.musikklokaler.no/map).

The results are depressing: 85 % of the rooms are not suited for the type of music for which they are used. A faulty type of acoustics can enforce the music ensemble to adapt to wrong balance between the instruments, making the musical interaction much more difficult and reducing the possibility for developing a good sound – both for each musician and for the orchestra or choir as a whole.

Unsuitable acoustics reduce the musical quality of the music group and give the conductor less possibility to work with and develop the musical quality. It also reduces the joy of playing or singing in a local music group. As the famous conductor Mariss Janssons used to say, “A good hall for the orchestra is as important as a good instrument is for a soloist.”

Different types of music need different types of rooms and different acoustical conditions. We can divide the music genres into three main groups:

  • Acoustically soft music, such as singing and playing instruments that are relatively quiet, such as string instruments, guitars etc. and smaller woodwind ensembles.
  • Acoustically loud music, such as playing brass instruments and percussion instruments, brass bands, concert bands, symphony orchestras and opera singing.
  • Amplified music, such as pop/rock bands, amplified jazz groups etc.

The Norwegian Standardization Organization established a working group, with participants from the Council for Music Organizations in Norway, the music industry, municipalities, acoustic consultants, The Union of Norwegian Musicians and others. Together, this group has developed the National standard, “Acoustic criteria for rooms and spaces for music rehearsal and performance” NS 8178:2014.

The Norwegian standardization group has divided rooms into five categories and provided specific requirements for each:

  • Individual practice room (1-2 musicians practicing)
  • Small ensemble room (3-6 musicians, teaching rooms)
  • Medium size ensemble room (up to 20 musicians/singers)
  • Large ensemble room (for choir, school band, concert band, symphonic band with brass/percussion, acoustic big band)
  • Performance rooms, subdivided into four types of rooms
    • Amplified music club scenes (small jazz, pop, singer/songwriter)
    • Amplified music concert rooms (pop/rock/jazz/blues)
    • Acoustic loud music (concert band, symphony orchestra, brass band, big band)
    • Acoustic quiet music (vocal group, string orchestra, folk music group, chamber music)

VOLUME – the most important criterion
Too small a volume turns out to be the main problem for many ensembles. A survey of Norwegian choir rehearsal rooms shows that 54% of the rooms are excessively small (less than half the size they should have been), 22% are too small and only 24% have more or less enough volume.

Query Norwegian singer’s organization, spring 2016. Rehearsal room size.
Figure 1.: Query Norwegian singer’s organization, spring 2016. Rehearsal room size.

For wind bands, we see more or less the same situation where the rooms are in general too small. In music schools, there are also many studios that are too small. The result is that the music is far too loud, and it is very difficult to work with sound quality and dynamic expression.

ROOM GEOMETRY – criterion number 2
This criterion poses not so many problems, apart from the fact that the room height is often too small, particularly in rehearsal rooms, but also in a number of concert rooms. A low ceiling is bad for the sound quality of the instruments and makes it difficult to hear each other.

REVERBRATION TIME – criterion number 3
There are often problems with the reverberation time, different for each of the three types of music. For acoustic soft music, the reverberation time should be relatively long in order to give support to the music, but it is very often too short in rehearsal and concert rooms. For acoustic loud music, the reverberation time should be moderate in order to avoid the music to be too loud, but it is often too long – or sometimes too short.

For amplified music, the reverberation time should be short, and this is quite often the case. However, it is especially important to have sufficiently short reverberation time in the bass (the low frequencies); otherwise the music makes an unpleasant booming sound.

The Norwegian standard provides a basis for better design of new music rooms. The systematic collection of acoustic reports of music rooms gives important background for recommendations on how to build or refurbish rooms for music in schools and cultural buildings.


Picture 1: Brass band rehearsal at Toneheim college, Norway, Credit: Trond Eklund Johansen, Hedmark/Oppland Music Council

2aAB3 – A Loud, Ultrasonic Party

Quantifying complex bat calls to understand how bats echolocate in groups

Contact: Yanqing Fu, yfu@saintmarys.edu

Yanqing Fu, Laura N. Kloepper
Department of Biology, Saint Mary’s College,
Notre Dame, IN 46556

Popular version of paper 2aAB3, “First harmonic shape analysis of Brazilian free-tailed bat calls during emergence.”
Presented Monday morning, June 26, 2017
173rdASA Meeting, Boston

Imagine you are at a party. The music is loud and lots of people are talking. How can you hear your voice and those of other people? Similarly, bats face this problem when in groups. When a single bat uses echolocation, it emits an ultrasonic call (above 20 kHz) and extracts environmental information by analyzing echoes.

But for bats that live and travel in large groups, echolocation should be challenging. Under these circumstances, they should encounter the problem of sonar jamming, where they might have a hard time distinguishing their echoes from other bats’ and their own calls. One bat species that is known for extreme grouping is the Brazilian free-tailed bat, Tadarida brasiliensis.

bats

Figure 1: Brazilian free-tailed bat (Tadarida brasiliensis) emergence, which usually occurs from 16:00 to 20:00, last about 15 minutes.

These bats can quickly change characteristics of their calls when probing different environments and performing different tasks. These call characteristics include duration, repetition rate, and frequency (or pitch). The shape of a call, how the call changes frequency over time, may provide important echo information to the bat.

Brazilian free-tailed bats can change the call shape from a straight line (constant frequency) to a downward curved line (nonlinear frequency modulation) and finally an inclined line (linear frequency modulation) within milliseconds (Fig. 2). Additionally, the bats can emit different frequency components at the same time. The call shape variation of bats flying in a group might help us to understand how they avoid sonar jamming.


Figure 2: Typical call shapes of Brazilian free-tailed bat (Tadarida brasiliensis).

In order to investigate how these bats change calls while flying in groups, we developed a new method to identify the shape of a bat call and quantitatively compare different call shapes. This method separates the multiple frequency components of bat calls (called harmonics) and tracks the trend of frequency over time using advanced digital signal processing techniques (Fig. 3).

Once these trends are extracted, call shapes can be quantitatively compared through point-to-point comparison by aligning different call durations. This method is the first important step to understanding how bats avoid sonar jamming while in large groups. We hypothesize that some call shapes are more robust to distinguish than others when in a chaotic sound environment.

Figure 3: Typical procedures for the isolation and tracking the first frequency component of the Brazilian free-tailed bat echolocation call. (a) Original echolocation call; (b) low frequency noise free call; (c) noise among different frequency components was removed; (d) isolated clean first frequency component; (e) call shape was extracted, black solid line superimposed on the isolated frequency component.