|
In contrast to air or water, rocks and other earth
materials are remarkably nonlinear. Furthermore, the
nonlinearity is quite complex and is the reason that several
different, clearly distinct behaviors are observed. For
example, we see nonlinearity in rock at incredibly low
levels (where wave motions are on atomic scales) and memory
effects at higher levels. The point of our study is to learn
more about the properties of rocks by studying the various
types of nonlinear behavior present in rock. It also may
turn out that understanding cracked materials like rock will
lead to an increase of our understanding of fatigue and
cracking in common engineering materials.
|
|
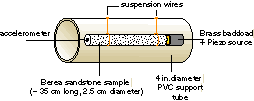
Our experiments are simple. A long thin rod of rock--like
an organ pipe--has a resonance frequency. (It's even
conceivable that one could build a small organ out of
various sizes and types of rocks! ) By putting a lightweight
piezoelectric source at one end (see the figure at the
right), we can drive the rod at successively increasing
frequencies, listen for the resonance peak (with a device
which measures the acceleration at the end), and plot an
entire resonance curve for different driving amplitudes.
We've done these sorts of experiments with several types of
rocks. In what follows we'll show results we obtained on
Berea sandstone, a common, easily obtained oil/gas reservoir
rock.
|
|
|
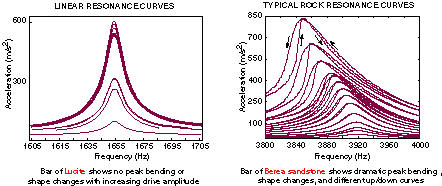
The figure below shows how different a sandstone
rod is compared to a rod made of a linear material. A set of
resonance curves taken on a lucite rod (shown in left hand
side of the figure) shows that the lucite behaves much like
an organ pipe. It has a single resonance frequency no matter
how "loud" we make the drive. Constrast the lucite resonance
curves with those of a Berea sandstone rod (right hand side
of the picture). If an organ pipe behaved like the sandstone
shown below, the resonance frequency would drop the louder
you blew on the pipe. A drop in resonance frequency with
increasing drive means that the rock is getting softer,
i.e., not as stiff, at higher drives. There are other
more complex behaviors one can see in the picture: the shape
of the resonance curves changes and frequency sweeps up and
down through resonance aren't the same.
|
|
|
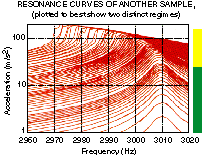
Two behaviors. We've found two rather different and distinct
nonlinear behaviors in the samples we've examined. The
picture to the right shows approximately where each behavior
dominates. One such regime occurs at very low strains (shown
by the green bar on the right hand side). Here it's likely
that only a small number of grains are participating in the
resonance and any actual movement (e.g., opening and closing
of cracks, fluid movement within cracks and pore spaces) is
on atomic scales. At higher strains (shown by the yellow
bar), the rock's nonlinearity starts to become much more
obvious (and very different in character as well).
|
|
|
|
|
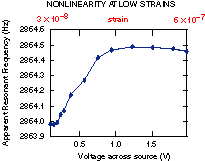
At very low strains,
we find nonlinearity. To our knowledge, this has never been
reported elsewhere. The picture to the left is a plot of the
resonance frequency as the drive level is increased. The
plot shows something very interesting and unexpected: the
rock never shows linear behavior! As the drive amplitude is
increased, the rock first stiffens and then begins to soften
(which continues up to and into the next regime). Such
nonlinearity is rare in acoustics. We hope that studying
nonlinearity at these low strains will tell us much about
the rock's microstructure.
|
|
At higher strains,
the resonance frequency shifts, resonance-curve shapes
change, and different up and down resonance curves begin to
appear. What causes these effects? It appears as if the rock
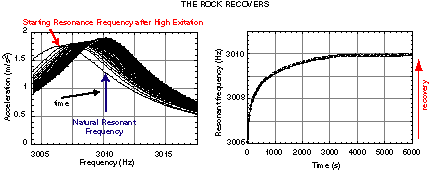
has memory. We find that when you drive a rock hard, it
softens (becomes like a softer spring) and stays that
way for some period of time. In fact, you can devise an
experimental recipe which demonstrates this nicely. Start
with a virgin rock, measure its initial resonance frequency
at a low amplitude, then drive it hard for a period of time.
The result should be a softer rock. To test, turn the
large-amplitude drive off, plot a series of successive
small-amplitude resonance curves (see the figure below), and
watch the rock gradually stiffen. The rock should finally
end in the state it started (several minutes or hours later,
depending on the rock).
|
|
|
|
|
For further information on various other aspects of
nonlinearity, see our web site via the following URL:
http://www.ees4.lanl.gov/Nonlinear
|