Acoustical Society of America
136th Meeting Lay Language Papers
[ Lay Language Paper Index | Press Room ]
Active Control of
Automobile Cabin Noise
with Advanced Speakers
Automobile Cabin Noise
with Advanced Speakers
Jerome C. Couche- jcouche@vt.edu
Francois Charette, Christopher R. Fuller**
Vibration and Acoustics Laboratories
Department of Mechanical Engineering
Virginia Polytechnic Institute and State University
Blacksburg, VA 24061-0238
Contact Information During ASA Meeting:
757-623-0930
Popular version of paper 2pSA6
Presented Tuesday afternoon, October 13, 1998
136th ASA Meeting, Norfolk, VA
Noise levels in human settings have recently come under scrutiny for reasons including health concerns and improvement to the general quality of life. Suppressing this noise has also become the focus of extensive research. Noise is defined as the part of sound that is unwanted because it is either harmful or undesirable to humans or the environment. Today, the most commonly applied technique to reduce the amount of disturbing noise is passive, which means that dampening materials, like foam, are applied as a treatment to the wall of a room or the panels of an aircraft or automobile, for example. Another common practice in passive control is to increase the wall thickness of a structure such as automotive window glass. This method has been proven effective for high frequencies above 1000 Hz due to their short wavelengths, while active noise control techniques work better for frequencies below 1000 Hz. The principles of active noise control have been understood since the beginning of the century, but have not been realizable until the advent of fast computational devices such as computers. The concept of active noise control is to add to the sound field with a secondary noise source (a speaker, for example), which destructively interferes with the undesired noise. Much research is currently being conducted in aeronautics for the attenuation of propeller and jet engine noise as well as in automobiles for engine and road induced tire noise to reduce levels in the passenger cabin.
The goal of the research presented here, is active control of low frequency (40 to 500 Hz) power train noise in a Ford Explorer. The experimental set up is presented in figure 1. It involves four microphones located close to the head of the passenger and driver to measure the noise levels that passengers experience. Four speakers, two of which were the actual front speakers of the stereo system and the two others were moveable speakers, are used as the secondary sound source to create the destructive interference. Finally, three accelerometers (which measure vibration) are located on the engine firewall, inside the cabin, and also on the oil fill stem in order to provide control reference signals as illustrated in figure 2. The control algorithm is adaptive which means it can compensate for changes in the disturbance while it is running online. Changes in the disturbance can occur from such actions as revving the engine, speeding and slowing of the vehicle, or change in road conditions. A personal computer (PC) was the host for a digital signal processor (DSP), where all the computation required in the adaptive algorithm was performed.
Based on the information obtained from the microphones and accelerometers, the algorithm computes the signal to be sent to each of the speakers in order to cancel the noise at the microphones. The results of the experiment are presented in figures 3 to 6. Figure 3 shows the frequency response at one of the microphones (error sensors) for the case of the power train noise, when the car is idling at 3500 rpm both before and after control is applied. The solid blue line represents the signal before control. It is dominated by a single fundamental frequency (22 Hz), which corresponds to the firing frequency of the engine and some of its harmonics (mainly at 134, 178, 222, 268 Hz*). The red line shows the signal at the same microphone, but after control. The effect of the active noise control was to cancel the various peaks in the frequency response, such that the maximum attenuation (difference between the levels before and after control) was 30 dB at 150 Hz. The overall reduction averaged across the entire frequency band (40 to 500 Hz) was 7 dB. The time signal at the microphone was recorded during the experiment and the reader can listen to the noise level before and after control in the '.wav' files. The spatial distribution of the sound field is presented before (figure 4) and after control (figure 5), together with the attenuation (figure 6) (difference between the levels before and after control). The region depicted in the figure has the following dimensions: 75 cm wide by 75 cm high by 65 cm long, which corresponds to the space filled by the head and torso of the front passengers. The plots show that attenuation was obtained in the vicinity close to the error microphones, but as the distance from the microphone increases the level of attenuation decreases. At distances far away from the error sensors, such as in the corner of the plot, the sound pressure level is actually increased. This spillover effect indicates the controller, when utilizing only 4 speakers, does not have the ability to achieve global control in the interior cabin of the car. Realizing global control means that the pressure level would be decreased or remains the same at all locations in the passenger cabin.
A previous analysis, not presented here, showed that due to the acoustic characteristics of the cabin (high damping) many speakers are required to obtain global control. In conclusion, the active noise control application presented here shows good results in reducing the sound pressure level in a large zone around the heads of the driver and passenger. The potential of the use of this active noise control technique becoming commonplace in the future resides in lowering the cost, weight, and space requirements of the different components of the system. The Vibration and Acoustics Laboratories at Virginia Tech is currently working in introducing a lightweight and compact speaker into the controller. Another related branch of this research is aimed at modifying the algorithm such that it would be possible to locate the microphones away from the region to be controlled, in the headliner for example, with noise still being cancelled at the head level.
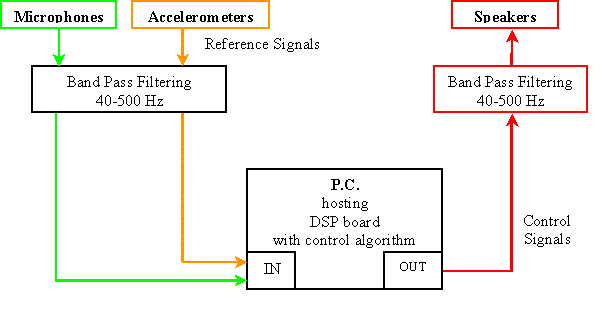
Figure 1: Control block diagram
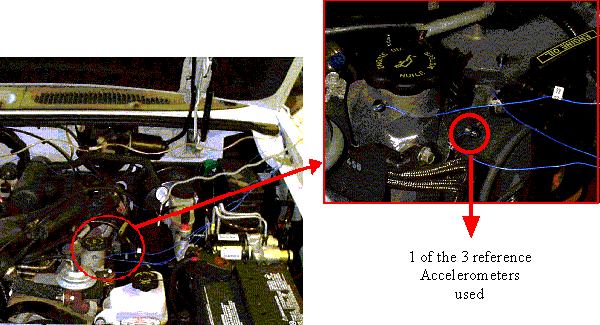
Figure 2: Reference Accelerometer Location
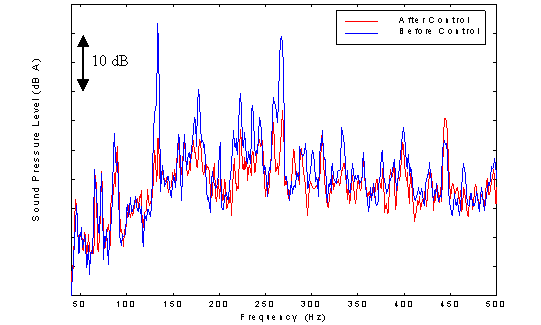
Figure 3: Spectra at the Error Sensor
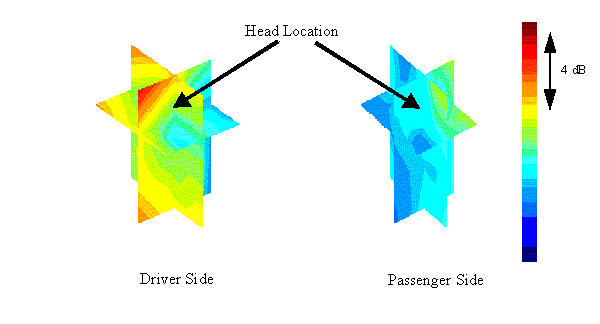
Figure 4: Spatial Sound Distribution Before Control
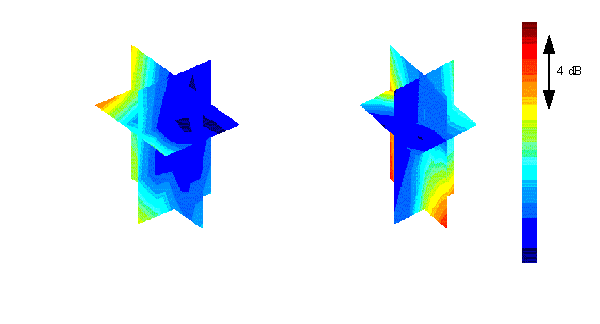
Figure 5: Spatial Sound Distribution After Control
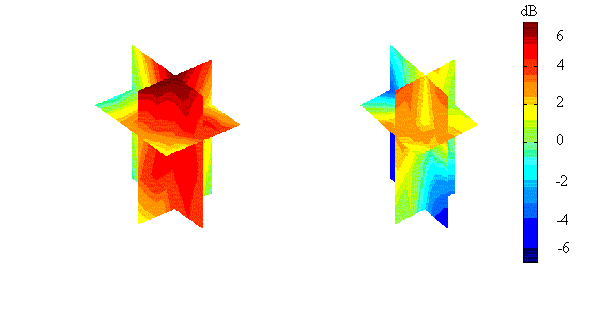
Figure 6: Spatial Distribution of Sound Attenuation
Sound file: couche.wav