Dimitris Menemenlis - dimitri@pacific.jpl.nasa.gov
Jet Propulsion Lab, California Institute of Technology
Mail Stop 300-323
Pasadena CA 91109-8099
Popular version of paper 3aA0b
Presented Wednesday morning, March 17, 1999
ASA/EAA/DAGA '99 Meeting, Berlin, Germany
The ocean stores and transports vast quantities of heat, fresh water, carbon and other materials, and its circulation plays an important role in determining both the Earth's climate and fundamental processes in the biosphere. Understanding the development of climate and important biological cycles therefore requires detailed knowledge of ocean circulation and its transport properties. That in turn requires observing and modeling a global-scale turbulent flow field, so as to adequately depict its complex temporal and spatial evolution. Studying climate-scale variability is very difficult, however, because it is masked by an intense 100 km spatial scale variability (the so-called mesoscale) as well as higher frequency internal waves. Two recently developed observational methods - satellite altimetry and acoustic tomography - are especially suitable for detecting climate-scale changes because they provide large-scale averages.
Satellite altimetry depends on the travel time of radio waves reflected at the sea surface to measure the sea surface elevation relative to the geoid, that is, relative to the particular gravitational equipotential to which the sea surface would conform if it were at rest with no forces acting on it. Changes in elevation result from local exchange of mass and heat with the atmosphere through the sea surface and from lateral water movements. In general terms, surface elevation and its slope provide a dynamical surface boundary condition on the general circulation.
The second observational system, ocean acoustic tomography, relies on the travel time of sound waves through the (electromagnetically opaque) ocean interior. Tomography integrates the oceanic state along many paths through a volume of fluid by transmitting sound pulses from sources to receivers. Perturbations in travel time of acoustic pulses are dominated by temperature perturbations. Hence acoustic tomography can act as a large scale ocean thermometer and provide accurate measurements of heat content, an important climate variable.
The combined power of these two technologies for studying the large scale circulation has been demonstrated in two recent experiments, THETIS-2 in the Western Mediterranean and ATOC in the North Pacific. In both experiments, the altimetric and acoustic data are combined with general circulation models, meteorological analyses, and direct measurements from ships. These model/data combinations provide regional descriptions of the time-evolving state of the ocean which are more complete and accurate than either the model or the data alone. They are an analogue of what is required globally to address various climate related questions, for initializing seasonal to interannual climate predictions, as well as for navigation and exploration purposes.
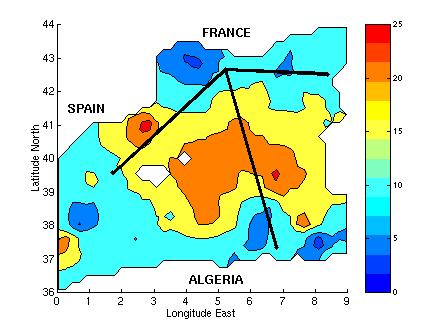
Figure 1: Study area for the THETIS-2 experiment in the Western Mediterranean.
The colored contours indicate sea surface height change in centimeters between
March and September 1994 from the TOPEX/POSEIDON altimeter. The black lines
are acoustic tomography sections. The sea surface height increase from March
to September is indicative of seasonal warming but includes complex
contributions from changes in wind forcing, from evaporation and
precipitation, from river runoff, and from flows through the Straits of Sicily
and Gibraltar. Acoustic tomography and a numerical model of the circulation
are used to separate the respective contributions to sea level anomaly.
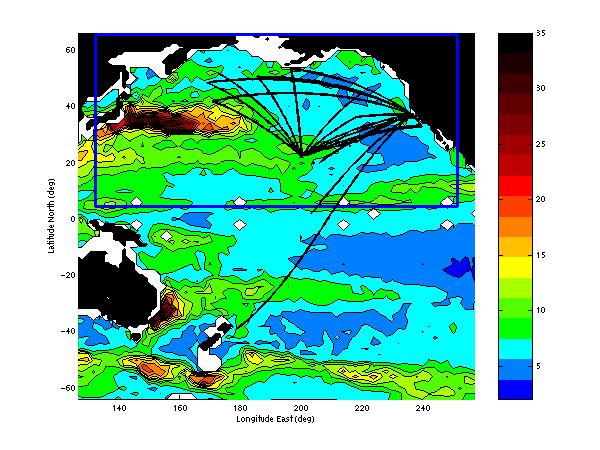
Figure 2: The ATOC acoustic array (black lines) is superimposed on a map
indicating sea surface height variability in centimeters obtained from
TOPEX/POSEIDON altimetric measurements. About half of the sea surface height
variability represents seasonal thermal changes within the ocean. But changes
in sea surface height also include complex contributions from other processes,
with the acoustic data providing a stable spatial average of heat content
which it is otherwise difficult to obtain.
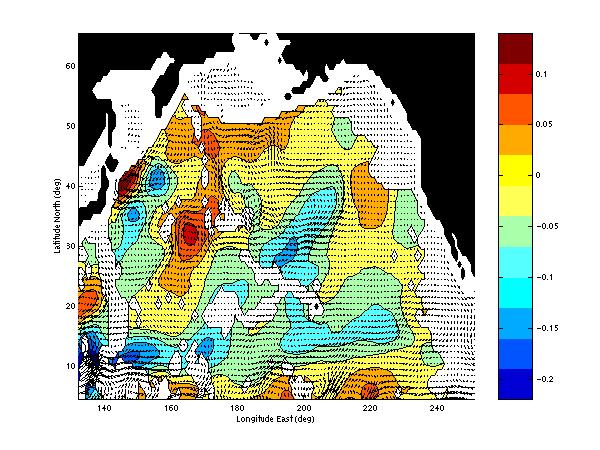
Figure 3: This figure illustrates results from a model/data combination which
permits a complete description of the time evolving state of the ocean. The
colored contours indicate temperature change averaged over the top 4000~m,
from January 1996 to January 1997 (white regions indicate depths less than
4000~m). The arrows indicate the corresponding change in velocity at 610~m,
the largest change being about 5 cm/s. This type of results are being used to
study the large scale ocean circulation and to understand the role of the
oceans in climate and climate change.