
R. Daniel Costley - dcostley@mil-tec.com
Gary M. Boudreaux
MRT, Inc.
Oxford Enterprise Center
9 Industrial Park
Oxford, MS 38655
Popular version of paper 4aSA8
Presented Thursday Morning, November 13, 2003
146th ASA Meeting, Austin, TX
In bridges, one of the most important components to maintain and to inspect is the deck, the part on which people walk or drive their cars. A deck can deteriorate in ways that are hard to see.
The Automated Chain Drag System uses acoustics to locate delaminations in concrete bridge decks. Figure 1 shows a core from a concrete bridge deck containing a delamination. A delamination is a particular type of flaw, or defect, that can occur in decks. During construction, steel reinforcement bars, or rebar, are placed inside the bridge deck in a one-foot grid pattern approximately two inches below the top surface. This layer of rebar is susceptible to corrosion. Water from rain migrates through the porous concrete, which reacts with the steel rebar and causes corrosion. In many northern states salt is used to de-ice bridges. Salt exacerbates the problem and accelerates corrosion of the rebar. A delamination occurs when the corroding rebar expands and causes the top layer of concrete to separate from the bottom layer. Delaminations can cause potholes and can affect the structural integrity of the bridge deck if they grow too large.
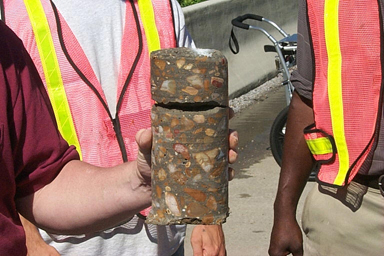
Figure 1. A core from a concrete bridge deck showing a delamination.
The traditional technique for detecting and locating delaminations in concrete structures, such as bridge decks, involves tapping the structure with a hammer or dragging a chain across it and listening to the audible response. A chain bar is shown in Figure 2. The chains are swept back and forth over the concrete surface. A distinctive, hollow sound occurs when the chains are dragged over a delaminated section of concrete. This technique has the advantage of being simple and inexpensive. However, it has the disadvantage of relying on the subjective interpretation of the inspector. In addition, the technique can be difficult to implement in noisy environments, for example, inspecting one lane of a bridge deck while traffic passes in the other lanes. Moreover, archival of such data is inconvenient.
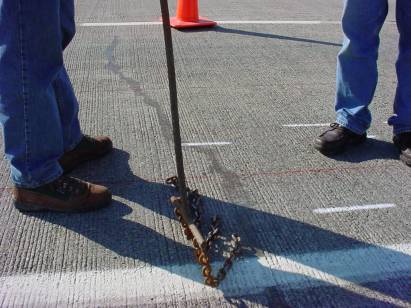
Figure 2. Inspecting a bridge deck with a chain bar.
These disadvantages have been overcome by automating the chain drag method of inspection. This has been accomplished by recording the sound produced by a dragging chain with a microphone and processing these signals with a minicomputer to distinguish between delaminated and intact sections of concrete. The equipment was mounted on a hand-pushed cart with chains attached so that they drag along the surface of the deck. These improvements make the technique operator independent and allow inspections to be made in noisy environments. Two views of the ACDS are shown in Figure 3.
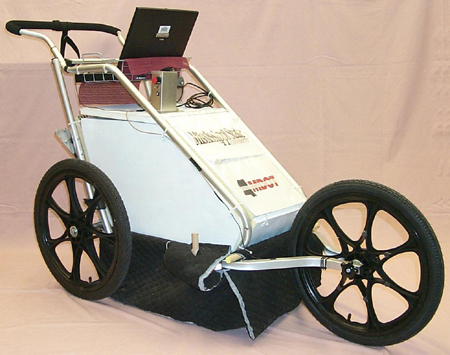
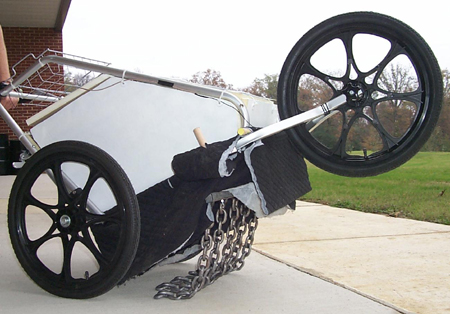
Figure 3. The Automated Chain Drag System.
The ACDS is being used in Figure 4 to inspect a bridge. (An inspector using the hammer tap method is in the right hand part of this picture.) Before inspecting a lane of a bridge, the traffic is first blocked off in that lane, but traffic can pass in the other lanes. The inspector starts at one corner of the lane and pushes the ACDS across the bridge, parallel to traffic flow. The scan is approximately 2 ft wide. After reaching the other side, the inspector turns around, moves over 2 feet, and scans in the opposite direction. The computer keeps track of the ACDS's location by a signal read from a bicycle odometer attached to the front wheel.
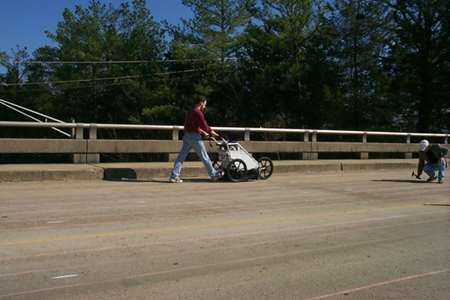
Figure 4. A person scanning a bridge deck using the ACDS. The person on the right is using the conventional hammer tap method.
This approach produces an objective record of the inspection, which can be presented in map form. A defect map of a segment of a bridge on Minnesota Highway 10 near Little Falls is shown in Figure 5. The dark areas indicate areas where the concrete has delaminated. It took six scans to inspect this lane. The two sound files are from the scans enclosed in the red boxes. These scans were made going in the direction from 160 to 260 ft. The delaminated areas can clearly be heard. Notice the automobiles and trucks passing during the scan at 10 ft (listen). These signals are rejected by the ACDS system and not interpreted as being defects, even though they are as loud as the delamination signals. Most of this noise is filtered out when the signals are processed in the computer.
Figure 5. Part of a defect map showing areas of delaminations. The scans in the enclosed red boxes correspond to two wav files. These two scans were made going from 160 to 260 ft. Click the speaker icons to hear associated sound files.
These records can be compared to past and future inspections, allowing the inspectors to monitor the health of the structure. They are also useful tools in estimating the time and materials needed to repair the bridge.
ACKNOWLEDGEMENTS
This work has been sponsored by the Mississippi Department of Transportation,
Bridge Division, and the Diagnostic Instrumentation and Analysis Laboratory
at Mississippi State University.