Kent L. Gee - kentgee@byu.edu
Acoustics Research Group
Dept. of Physics and Astronomy
Brigham Young University
Provo, UT 84602
Victor W. Sparrow, Anthony A. Atchley, and Thomas B. Gabrielson
Graduate Program in Acoustics
The Pennsylvania State University
University Park, PA 16802
Popular version of paper 3aNS3
Presented Wednesday morning, June 6, 2007
153rd ASA meeting, Salt Lake City, Utah
The Sound of Freedom
No, this paper is not about breakfast cereal, but rather the noise emitted by military jet aircraft (aka “the sound of freedom”). If you attend an air show where F-16s or other high-performance military aircraft are featured, you may hear a staccato-like “crackle” in the noise as the aircraft passes by. Crackle is often present in the noise from military jet aircraft when the engines are at or near maximum thrust. It is also readily apparent in Space Shuttle liftoffs.
Crackle Demonstrated
Links to two online videos are provided so that you can hear what crackle sounds like. In the first video, an F-18 Super Hornet performs at an air show. The most noticeable crackle occurs at about 2:55 into the video during a high-speed flyby. In the second video, which is footage of the Space Shuttle Discovery’s July 4, 2006 liftoff, crackle is first noticeable in the noise a little over one minute into the video.
Representing Crackle in Data
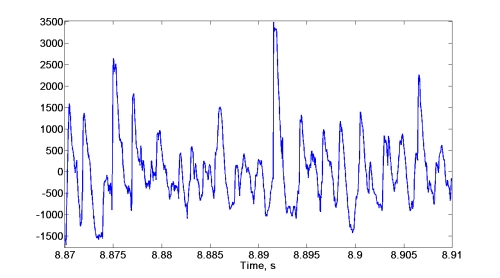
What causes this unique and highly audible characteristic in jet and rocket noise? Sound travels through the atmosphere as a pressure wave that alternates between compressing (positive pressure) and expanding (negative pressure) the air in its path. Acoustic measurements made near a high-speed exhaust plume show a random but continuous series of pressure spikes. The pressure waveforms for most sources of acoustic noise show an equal distribution of positive spikes and negative spikes. But crackle is different. The positive spikes are shorter in duration than the negative spikes; however, the positive spikes are considerably larger in amplitude than the negative spikes. This can be seen in Fig. 1 for data recorded from the Super Hornet.

Figure 1. Variation in pressure for the F/A-18E Super Hornet. The positive spikes are larger but shorter in duration that the negative spikes.
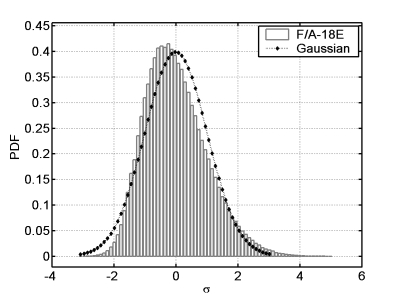
Researchers often show the differences in pressure variations by constructing a plot in which the various pressures from most negative to most positive are laid out along the horizontal axis and the number of times those pressure values appear in the waveform is indicated by the height of the curve above that scale. This plot – a histogram – is shown in Fig. 2 for afterburner noise from an F-18 Super Hornet. On this plot ordinary noise appears as a symmetric “bell” shaped curve. The crackle noise from the Super Hornet’s afterburner is skewed showing more frequent negative pressures than positive pressures but also showing that the peak positive pressures are greater than the peak negative pressures. Because of the asymmetry of this and other jet noise data distributions, researchers have, for more than 30 years, correlated crackle with a measure of the asymmetry – the skewness coefficient – of the distribution.

Figure 2. Histograms of the pressure distribution of the Super Hornet compared to a Gaussian bell curve. Note the asymmetry of the Super Hornet histogram relative to the symmetric bell curve.
But skewness alone does not guarantee crackle. We created a simulated waveform that was equivalent to the F/A-18E noise waveform in that it has the same distribution of noise power with frequency and the same skewness as the actual data, but clearly does not crackle. The simulated waveform can be heard in the link below:
The Cause of Crackle
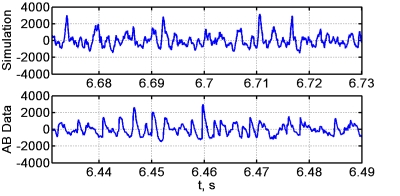
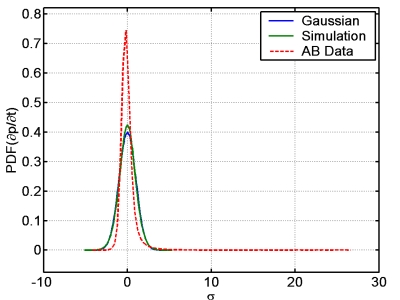
So what does cause our perception of highly audible snap-crackle-pop in jet and rocket noise? While the Super Hornet waveform and the simulated waveform have the same basic statistics, the Super Hornet waveform shows much sharper pressure rises than the simulated waveform (see Fig. 3). If, instead of constructing the histogram of pressure values, we construct the histogram of the different values of the rate of change of pressure, this rate-of-change histogram shows dramatic differences between the simulated and actual Super Hornet waveforms. The broad positive tail in Fig. 4 for the afterburner data corresponds to the infrequent but very rapid pressure rises in the data. If we generate an artificial waveform having the same distribution of pressure changes, we hear crackle. Consequently, the “snap, crackle, pop” in jet and rocket noise is probably the result of our ears responding to the extremely rapid pressure changes in the waveform rather than from the simple asymmetry in pressure.

Figure 3. Portions of the simulated and actual afterburner (AB) data. An example of a very rapid pressure rise in the AB data occurs at about 6.46 seconds. The pressure changes in the simulation are not nearly as rapid.

Figure 4. Histograms of the time rate of change of the pressure rise for a Gaussian bell curve, the simulated waveform, and the actual data. The dramatic positive tail on the AB data accounts for the crackle events not present in the simulated waveform.
The Impact of Crackle
Why do we care about understanding crackle better? The main reason is that researchers are working to find ways to reduce the noise emitted by military jet aircraft. Because crackle can dramatically change our perception of the noise, understanding why we hear crackle may aid future research efforts in making these aircraft quieter and minimize their noise impact on military personnel, communities, and the environment.