
Michelle E. Swearingen – michelle.e.swearingen@erdc.usace.army.mil
Michael J. White, Patrick Guertin, Jeffrey Mifflin, and Timothy Onder
US Army Corps of Engineers
Engineer Research and Development Center
Construction Engineering Research Laboratory
Champaign , IL 61822
Donald G. Albert and Stephen Decato
US Army Corps of Engineers
Engineer Research and Development Center
Cold Regions Research and Engineering Laboratory
Hanover , NH 03755
Arnold Tunick
US Army Research Laboratory
Adelphi , MD 20783
Popular version of paper 2aPAa2
Presented Tuesday morning, June 5, 2007
153rd ASA Meeting, Salt Lake City, UT
The way that sound travels through a forest edge has implications for noise mitigation and acoustic detection systems. While the acoustical significance of this unique environment has been noted, it has not been studied in any detail. Acoustical signals that propagate through a forest edge yield complicated pressure-time histories for listeners both within and outside the forest. Several physical processes contribute to this complexity, including the physical structures of the biomass and ground and the microclimate.
An experiment was conducted to determine the influence of a forest edge on acoustical propagation. To simplify the situation, we chose a site with a single-age planted monoculture of regularly-spaced red pine (Pinus resinosa) with an adjacent open field area, on flat ground, having a distinct and straight forest edge. Growth at the forest edge included only red pine, with no additional herbaceous growth. Selecting a site with only these characteristics minimized the number of variables to be considered in the analysis. Figure 1 is a photograph of the test site, taken from the open field and showing the forest edge. Figure 2 is a photograph of the test site, taken from inside the forest and showing the forest edge.
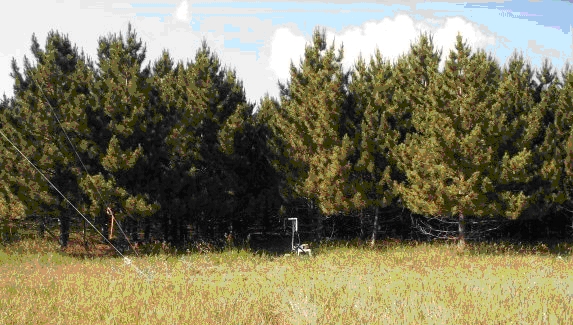
Figure 1: View of the forest edge from the open field.
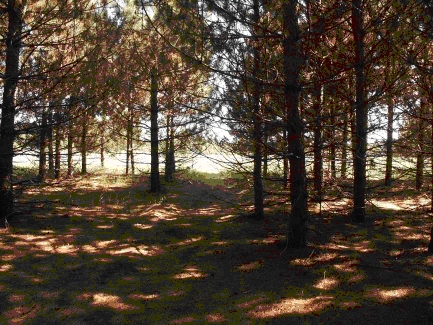
Figure 2: View of the forest edge from inside the forest. Note the regular spacing of the trees.
Weather during the field experiment was generally sunny and clear, with light winds. Detailed meteorological measurements were logged every five minutes from instrumented towers placed in the open field, at the forest edge, and in the forest interior. Each tower was 13 m high and had sensors at five regularly spaced heights. Figure 3 is a photograph of the tower at the forest edge.
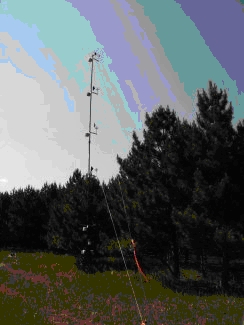
Figure 3: View of the forest edge meteorological tower. Each height is instrumented to record temperature, relative humidity, and wind speed and direction.
Microphones were placed mainly along a line passing from point BP1 in the open field and perpendicularly through the forest edge. Additional microphones were placed along a second line from BP1 to the forest edge at an angle of 25º from the main line. A complete layout schematic is included in Figure 4. For the purposes of this article, only microphones A1-A3 and S1-S3 are considered, and only source point BP1 is considered.
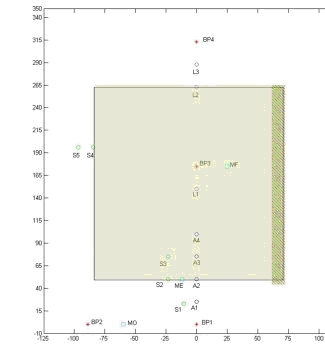
Figure 4: Schematic of the sensor layout. A1-4, S1-5, and L1-3 are all microphone locations. BP1-4 are source locations. MO, ME, and MF are meteorological tower locations. The shaded rectangular area represents the forest and the green hash marks indicate that the forest continues in that direction. Distances are in meters.
Pressure-time histories of individual shots from a propane cannon (bird scare-away device) were recorded for analysis. Signals were processed to obtain peak sound pressure levels (maximum sound pressure attained) and sound exposure levels (total sound) and 1/3-octave band sound exposure levels (SELs), which provide the sound levels in decibels for a range of frequencies collected into groups known as third-octave bands.
By comparing the measured sound levels at locations A1, A2, and A3 to locations S1, S2, and S3, it should be possible to determine whether those levels are affected by the direction from which the sound impinges on the forest edge, or in other words, the angle of incidence. When comparing A1 to S1 and A2 to S2, there is a small difference between them. S1 and S2 are both 2-3 dB lower in level than A1 and A2 respectively for frequencies below 600 Hz. Above 600 Hz, the differences are greater and not as regular. These differences may be due to source directivity and the influence of the path. At 25 m beyond the edge at points A3 and S3, the differences are essentially gone, and the measured signals are essentially identical at those points. This holds true for 1/3-octave band Sound Exposure Levels (SELs), as well as peak sound levels at specific frequencies. After passing 25 m into the forest, the sound level is insensitive to direction of arrival. The signal levels have been homogenized. The 1/3-octave band sound exposure levels are shown in Figure 5. The peak levels are shown in Table 1.
Position |
Peak Level (dB) |
A1 |
141 dB |
S1 |
139 dB |
A2 |
127 dB |
S2 |
125 dB |
A3 |
120 dB |
S3 |
120 dB |
Table 1: Peak levels (dB) for microphone positions A1-3 and S1-3.
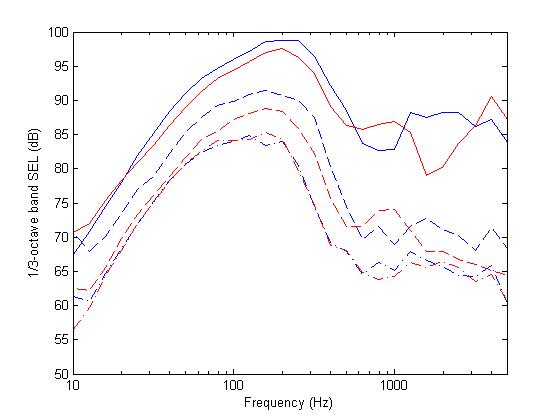
Figure 5: Comparison of A1-3 to S1-3 in 1/3-octave band SEL. Blue lines represent A1-3. Red lines represent S1-3. (-) are A1/S1, (--) are A2/S2, (-.) are A3/S3.
If we instead look at the 1/3-octave band spectrum of the backscattered signals, we see that frequencies below 60 Hz do not backscatter in an organized way. This is expected, as the wavelengths are much greater than the trunk diameters, much like an ocean wave is largely unaffected by a pylon. Frequencies between 60 Hz and 800 Hz behave similarly for the incident and backscattered signals. Above 800 Hz, there is more separation between the backscattered signals at A1 and S1. Further study is needed to deduce the physical reason for this effect.
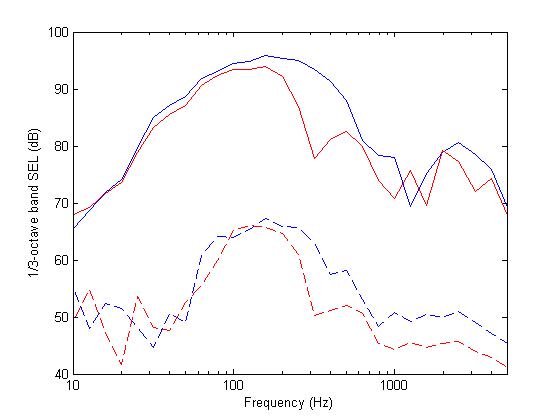
Figure 6: 1/3-octave band SEL of incident signals (-) and backscattered signals (--) received at A1 (blue) and S1 (red).
So far we have learned that, for small changes in angle of incidence, the direction from which the signal arrives has very little impact on the received signal. We have also determined that, at least for the situation described here, after a sound travels 25 m into a forest, some information about the direction to the source is lost. There are still many things to learn about the acoustic impact of a forest edge. This ongoing project will answer some of the questions, but will also likely raise even more about how sound travels in this complex environment.