Infrasound measurements during Hurricane Katrina
Ronald A. Wagstaff, rwagstaf@olemiss.edu
Carrick Talmage, and Heath Rice
National Center for Physical Acoustics,
University of Mississippi
University, MS 38677
Popular Version of Paper 1pPA3
Presented 4:40 p.m. Tuesday afternoon, November 27, 2007,
154th ASA Meeting, New Orleans, LA
Introduction
Vibrations are an important part of our lives. They influence what we hear and how we hear it. For example, we hear an opera madam’s song, when she makes her vocal cords vibrate in a systematic high-pitched manner, i.e., a high frequency rhythm. Her male counterpart may join her in singing the same song, but his voice will have a lower pitch. It is lower because his vocal cords are larger than hers. Large vocal cords of men vibrate slower than the smaller vocal cords of women. This results in a lower pitched voice for most men. In a similar manner small dogs, like terriers, have higher pitched barks than large dogs, such as Great Danes.
Another, more subtle aspect of pitch that has been observed by nearly everyone, is the abrupt change that takes place in an approaching train’s whistle, from a high pitch to a lower pitch, as soon as it passes the listener. Pitch is also a very important property of storms. However, like people, dogs, and trains, storms have a variety of sizes and speeds. They also make sounds with corresponding pitches that can be measured. For example, the “whistling of the wind” is a common and descriptive phrase that describes a relatively high-pitched sound sometimes heard on an especially windy day. As the wind dies down, the pitch decreases, and becomes more difficult to hear.
There are two reasons that the slower wind speeds become harder to hear. One is that, at slower speeds, wind has less energy to cause noise. The other reason, which is probably more important, is that with the reduced wind speed, the pitch of the wind-generated sound is also reduced. This reduction in pitch is especially important, because the human ear becomes less capable of hearing sound of any kind, below a certain pitch.
The focus of this paper is on the importance of some very low pitch sound that is silent to humans, called infrasound. Because we can’t hear infrasound, we may never be aware of it, even when it is present. However, it could play an important role in our lives at some time in the future, especially since we may be unaware of its presence. This paper illustrates that point through the example of Hurricane Katrina and its infrasound.
Background
A hurricane produces “naturally occurring” infrasound of such a low pitch that humans are unable to hear it. We can measure the pitch and strength of infrasound with special low-pitch atmospheric pressure sensors. The pitch, strength, and course of progress, for a hurricane are important to various types of earth scientists, who’s job it is to keep all of us safe from the hazards that accompany hurricanes and other large storms. However, they can’t do such a big and important job alone. They need help, some of which they get from specially designed low pitch measurement sensors, and corresponding data processing and analysis techniques that have been developed by fellow scientists and engineers. For example, newly developed data measurement equipment and data analysis techniques have provided valuable information about storms. This includes such necessary information as accurate location, spread, speed of advance, and the speeds and directions that the winds in the storm are moving, which may be different from the overall direction that the storm is traveling.
Results
Consider the case of Hurricane Katrina, which was in the Gulf of Mexico during August of 2005, and devastated the city of New Orleans before moving on. Figure 1 presents a satellite photograph, with Katrina, identified by the white swirling mass of clouds centered about the eye of the hurricane, i.e., the “hole” in the middle of the cloud mass near the center of the figure. North is at the top of the figure, and east is to the right. Some of the clouds appear that they are in the process of being stripped off to the northeast of the eye, unable to keep up with the high-speed counter clockwise rotational winds in Katrina, illustrated by the four arrows. As time progressed, Hurricane Katrina passed over New Orleans, leaving many parts of the city in rubble, and its residents seeking safe haven in other cities and states.
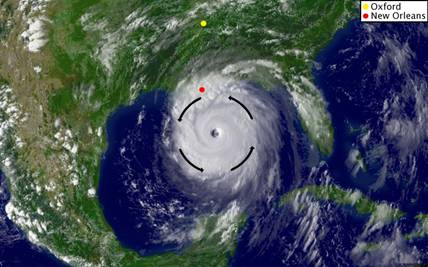 |
| Figure 1. Satellite photograph of the Gulf of Mexico, while Hurricane Katrina, the cloudy mass, was present, and ravaging New Orleans, red dot. The yellow dot is Oxford MS, where the infrasound measurement sensors were located. |
The arrows on the circle represent the directions of the counter clockwise rotating wind and wave fields of the hurricane at the surface of the Gulf of Mexico water mass. The northeast quadrant is the area in which the highest wind speeds and largest height of waves will be generated, with corresponding low pitch infrasound. In the case of Katrina, that sector eventually passed over New Orleans as Katrina progressed, devastating the city and the surrounding area before moving on.
The effects of Katrina’s winds were evident in a set of very low pitch, infrasound, acoustic data obtained by specially designed sensors that are capable of measuring acoustic signals at pitches lower than human ears can hear. The sensors were deployed in a vacant field near Oxford Mississippi, about 400 miles to the north of New Orleans, safely out of harms way. The results of these measurements are presented in Figure 2.
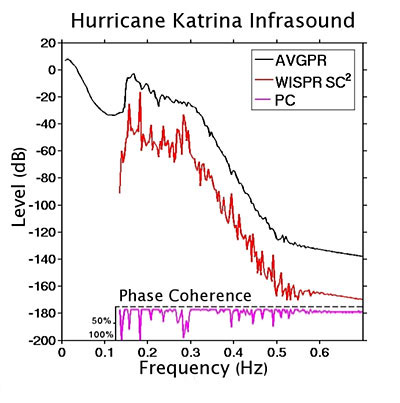 |
| Figure 2. Strength versus pitch curves for the Hurricane Katrina infrasound data analysis: AVGPR, WISPR SC , and CD measured near Oxford MS, 400 miles away. |
The vertical axis of Figure 2 gives the strength of the processed and plotted infrasound results, ranging from -200 to 20, with 20 being the greatest value. The horizontal axis gives the pitch with a range from 0.14 to 0.6. The black curve at the top of the plot, identified by the name AVGPR, presents the average strength curve for each value of pitch. The detail is sufficient to form a continuous curve over the range of infrasound pitches included. The red curve in the middle, is identified by the name WISPR SC2, and the magenta curve, at the bottom of the plot is the CD.
In this case, coherence means how well the detected signals conform to present knowledge of how other known infrasound signals have “behaved” in the past. Such things as how steady the amplitude has been over the time it took to acquire the data is very important to identify the difference between signals from noise. Amplitude by itself is not significant. Noise also has amplitude, but it does not have “self control.” It is unpredictably variable, that’s what makes it noise. On the other hand, signals are deterministic. That’s what makes them signals, and it also makes signal processing worth doing. Hence, a key to successful signal processing is to find a “behavior” that is a “personality characteristic” of the signals you are interested in, and then design the signal processor to focus on that characteristic in order to identify that type of signal and ignore all else, including noise.
WISPR SC2 is such a processor, as is the Coherence Diagnostic, CD, It is the magenta curve at the bottom of the plot. The characteristic that it focuses on, to identify signal from noise, is temporal coherence, i.e., systematic behavior of some parameter of a signal, such as amplitude, that can be counted on to have a predictable behavior. A simple behavior that almost always works is amplitude variations, or fluctuations, over a small time period, perhaps a few seconds. The fluctuations will generally be small for signals, and much larger for noise. A threshold can be set in the signal processor to pass every thing with small fluctuations, i.e., signals, and to block everything with large fluctuations, i.e., noise.
The AVGPR curve shows two broad local maxima at strengths of 10 and 0 and one local minimum at a pitch of about 0.1 with strength of approximately -30. There are no other significant features in this curve. This is not the case for WISPR SC2, the red curve. There are several local maxima, the most prominent ones having isolated signal peaks at pitches of 0.14, 0.2, 0.22, 0.24, 0.27, and 0.29. There are also several other locally high peaks at greater pitches, but they are out of the infrasound range of general interest, which extends only up to pitches of about 0.4. One very popular infrasound range of interest is the pitches from about 0.1 to 0.3, which includes the six signals previously mentioned.
These WISPR SC2 results represent a significant departure from what is has customarily been displayed for infrasound. There is usually only a single curve, similar to the AVGPR curve at the top of Figure 2. However, WISPR SC2 produces lines of considerable strength at various pitches that are easily identified by their substantial local maxima, as illustrated in Figure 2.
The magenta Coherence Diagnostic, CD, curve at the bottom of Figure 2 is an automatic detector of infrasound signals. It is displayed upside down. Its detector calculates the temporal coherence, i.e., repeatability of time-ordered sequences, of processed data. Results that match certain well known patterns are recognized and considered “detected”.
[ Lay Language Paper Index | Press Room ]