
The Pulse of a City: Noise Measurements
in Baltimore
Donald G. Albert - donald.g.albert@us.army.mil
Stephen N. Decato - stephen.n.decato@us.army.mil
ERDC Cold Regions Research and Engineering Laboratory
Popular version of paper 1pNSc1
Presented Monday afternoon, April 19, 2010
159th ASA Meeting,
Urban areas tend to have high levels of background noise
because of human, transportation, and industrial activities, and this noise
makes sensor design and operation challenging.
Currently, information about urban noise and vibration properties at low
frequencies of interest to urban sensors (10 250 Hz or cycles-per-second) is
still lacking. We used lightweight,
portable equipment to measure the acoustic and seismic noise levels in downtown
Background. The fundamental parameter that controls the performance of sensor systems and signal processing algorithms is the signal-to-noise ratio (S/N). This parameter can vary depending on the frequency, the desired signal emitter (a vehicle, for example), the weather, and the location where the sensor will operate. There have been many studies of emitters such as vehicles, aircraft, and industrial noise sources. But so far there have been few studies of the noise environment in urban areas at the frequencies used by sensor system designers.
Acoustic and seismic sensor systems are often designed to operate in the 10 to 250 Hz frequency band, because of two factors. First, many sound sources of interest, including vehicles, helicopters, and industrial machinery, emit their strongest acoustic energy at low frequencies between 10 and 100 Hz. Second, lower frequencies tend to be less attenuated with distance, and less affected by obstacles like buildings or other objects, than higher frequencies. The same factors are true for seismic waves.
While many noise studies and mapping efforts have been previously conducted in urban areas, these studies were done mostly to reduce noise effects on civilian populations, and so they concentrated on the frequency range of human hearing (about 125 Hz to 10,000 Hz) where nuisance effects are the strongest. Because of this goal, frequencies below 125 Hz were rarely measured or were often filtered out of the recordings.
Seismic (vibration) studies have rarely been conducted in urban areas. Permanent monitoring stations are usually located in remote areas specifically to avoid the noise produced by human activities. Since these studies are interested in measuring earthquakes at relatively long distances, their measurements focus on low frequencies below 10 Hz or even 1 Hz.
Methods. To provide more information about the urban noise environment for sensor system design and operation, we decided to make measurements in a number of different city locations, including downtown areas with tall buildings, commercial areas with smaller buildings, residential areas, and industrial areas. While we usually place our equipment and batteries in weatherproof boxes and mount our sensors on tripods, we couldnt do this in the city. Instead, we selected portable equipment that we could rapidly install to obtain snapshots of the noise without interfering with normal city activities. The equipment was powered by batteries and was capable of recording noise levels over a wide frequency band. To record the vibration levels, we connected a ground motion sensor called a geophone to one of the recorders. Everything fit in a normal-sized briefcase.
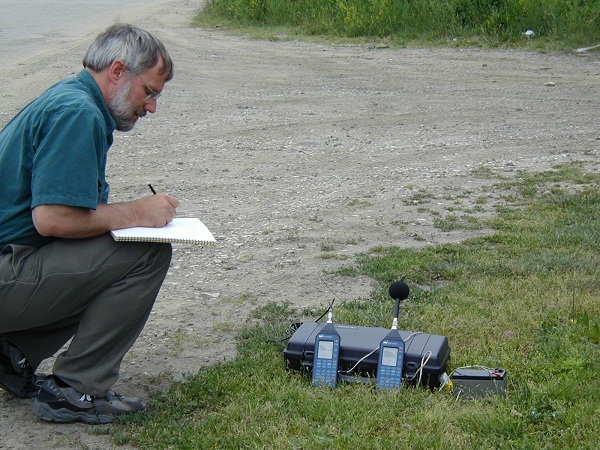
Figure 1. The instrumentation in use at a site near industrial activities. Two integrating sound level meters were used, one connected to a microphone and the other to a geophone. The instruments were powered with a small battery and all of the equipment fit in a standard briefcase, making it easy to move from one measurement location to another.
We tested this equipment by recording for a month at two
relatively quiet rural locations near our lab in
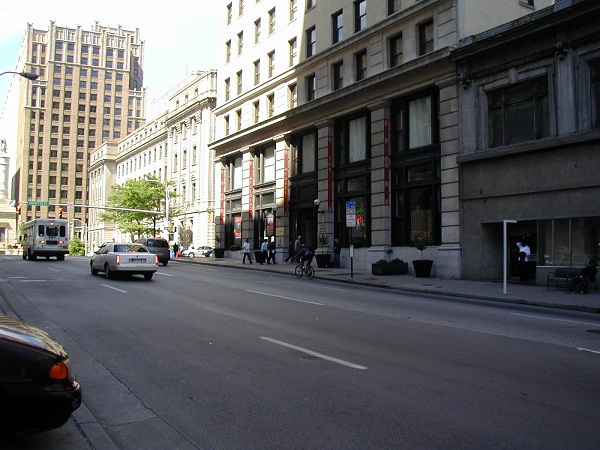
Figure 2. Ambient
noise measurements underway on
Results. The measured acoustic and vibration noise levels at ten different locations in the city are compared to the rural levels in Figures 3 and 4.
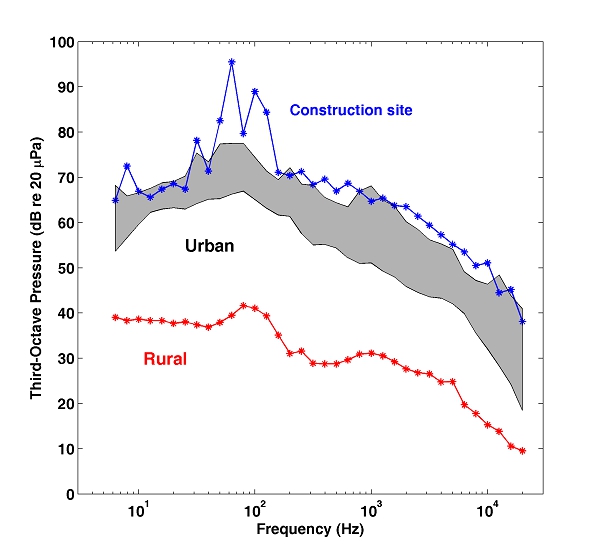
Figure 3. Comparison of acoustic noise levels measured in urban and rural locations. The gray patch shows the range of levels recorded for ten urban locations, the red line the average of two rural locations. The blue line was the loudest measurement we obtained and was located near a building construction site with jackhammers and circular saws causing the peak noise levels.
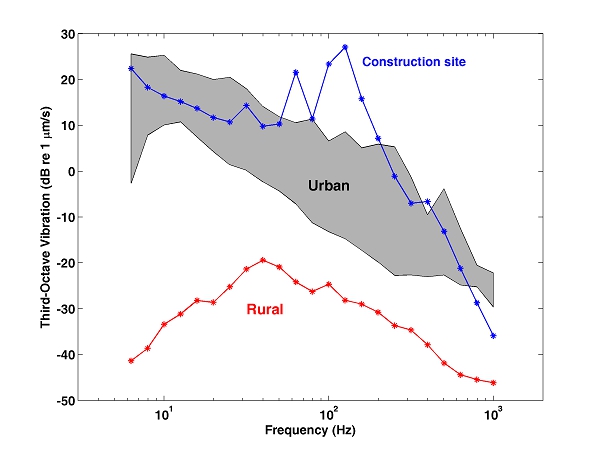
Figure 4. Comparison of vibration noise levels measured in urban and rural locations. The gray patch shows the range of levels recorded for ten urban locations, the red line the average of two rural locations. The blue line was the measurement near a building construction site.
These plots use a logarithmic vertical scale in which every 20 units corresponds to a factor of 10 difference in the noise level. The city levels are always much higher than the rural levels, usually a factor of 10 higher at all frequencies and for both sensor types. Like other researchers have found in the past, we noticed that the primary cause of urban noise was the amount and type of nearby traffic, and that quieter urban measurements were obtained when we were further from the main roads. The most striking difference between the urban and rural measurements was the far higher vibration levels we found in urban areas, especially for frequencies below 100 Hz. This difference is likely caused by the much higher traffic levels, and might represent signal to some well-designed sensors.
We were somewhat surprised that the industrial locations were not the loudest. This may be a result of intentional noise mitigation efforts like muffling of equipment and might not be true in other countries where noise regulations may be different. Aside from construction sites, where individual tools (especially jackhammers and circular saws) caused high levels at particular frequencies (see the Figures), the nosiest areas were in the downtown city core, with the heaviest traffic.
The measured noise levels for different locations within the city did not vary a great deal. Levels at specific frequencies varied by about a factor of 4 (12 dB) for the acoustic pressure, and by about a factor of 6 (16 dB) for the vibration levels.