
Portable
Loudspeaker Coverage Simulator for Outdoor Performance Spaces: The Sound of
Camden Yards
Juan Arvelo - Juan.Arvelo@jhuapl.edu
Shawn
Johnson - Shawn.Johnson@jhuapl.edu
Ronald Mitnick - Ron.Mitnick@jhuapl.edu
The
Johns Hopkins University Applied Physics Laboratory
11100
Johns Hopkins Rd.
Laurel,
MD 20723-6099
Popular
version of paper 2aNCe5
Presented
Tuesday morning, April 20, 2010
159th
ASA Meeting, Baltimore, MD
Have you
ever noticed how it can be more difficult to understand someone screaming from
a distance during the day than at night? Why can we still hear sounds coming
from around the corner of a building? Why is it that the noise from a standing
aircraft seems to eerily fade in and out on a hot day?
Sound transmission
is very sensitive to terrain and atmospheric conditions. The local topography
may range from grassy mountainous terrain to snow-covered urban landscape.
Sound absorption varies significantly with temperature and humidity. The
variability of temperature and winds with altitude are key drivers influencing
how sound bends as it travels. The wind direction adds another degree of
complexity by favoring downwind sound directions over upwind conditions. This
wide range of effects introduces a mind-boggling challenge for estimating the
optimal placement of loudspeakers in parks, stadiums, amphitheatres and other
open-air venues.
Many
audio engineers place their sound systems at textbook locations and crank up
their volume to ensure full coverage, ignoring potential hearing loss for those
closest to the speakers. If they had a highly portable capability to predict
loudspeaker coverage, they would be able to optimize speaker placement,
mitigating the need for cranking-up the volume.
We are
developing software installed on portable computers that models how the sound
coming out of a speaker travels -- taking into account the terrain and the
weather -- so that speaker placement may be optimized.
A
handful of research and commercial atmospheric sound propagation models have
been developed for specialized scenarios in urban and rolling terrains. However,
an obvious need exists for a more generalized algorithm that offers timely
sound propagation predictions while accurately accounting for the complexities
introduced by key climate conditions and local terrain. Undersea sound
propagation theories, algorithms, models, and databases have evolved more
quickly than the atmospheric counterparts. This is attributed to the fact that
oceanic sound absorption is much lower than in air, which allows undersea sound
to travel many miles away while it is limited to distances well below a mile in
air.
We
adapted a Gaussian Ray Bundle algorithm, widely accepted by the underwater
acoustics community, to be used for in-air acoustics. The algorithm was chosen
for its computational efficiency, accuracy, and ability to account for
wave-like phenomena such as sound diffraction around solid structures. Since
the selected customized underwater acoustic simulation application accesses all
the required environmental information from user-generated external data files,
there was no need to make a single change to this core module. Instead, a separate
higher-level control algorithm was developed to properly manipulate the terrain
and atmospheric data to automatically generate input files intended to fool
the core module into believing that it is conducting an undersea sound
propagation calculation. Software verification was conducted by comparing
results against those from computationally demanding wave-based models for simple
cases that yield closed-form analytic solutions. Additionally, simultaneous
atmospheric and acoustic measurements were collected for software validation in
a limited number of environmental conditions.
Even
though this newly developed software can be installed on any computer, todays
audio engineers prefer the higher portability offered by mobile devices. For
example, it was initially implemented on the Sony VAIO UX490N Ultra-Mini
Notebook computer. This mobile unit has a 4-in wide touch screen, a small
keyboard, a GPS antenna, built-in microphone, a 1.2 GHz Intel core solo
processor with 2 MB L2 cache, 1 GB of RAM, a 40 GB flash drive,
fully-functional MS Windows Vista Business operating system, Ethernet, USB, Bluetooth,
and wireless WAN connectivity. The built-in microphone is used to measure the
background noise and speaker loudness. The GPS capability yields the
coordinates for on-the-spot calculations. Ground level measurements of the
temperature and humidity are needed to estimate how sound is absorbed by the
atmosphere. Therefore, a Lascar EL-USB-RL real-time data monitor was connected
to the computer through its USB port for such measurements at regular time intervals.
The platforms flash drive is large enough to accommodate a 90-meter resolution
worldwide terrain database, which is available as the default for loudspeaker
coverage predictions in mountainous terrains. Its Internet connectivity allows
the user to download altitude-dependent atmospheric predictions or weather
balloon measurements from a number of climatological sites.
This
capability is also useful for forensic investigations or assessments of sound
detection, localization, and identification systems. For example, the acoustic
propagation from a loudspeaker placed above home plate in Camden Yards,
Baltimore, MD, on the 20th of April 2006 was modeled (On that day,
the Baltimore Orioles won their encounter against the Cleveland Indians by a
score of 9-4). Go Os!
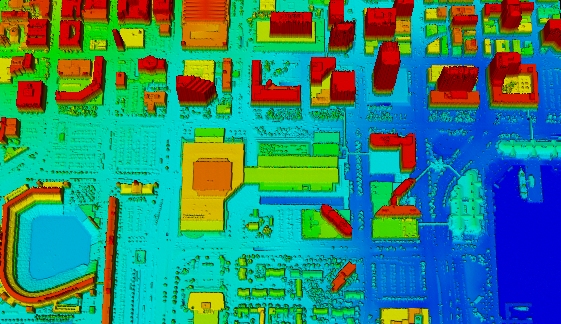
Since loudspeaker
coverage predictions in open-air performance venues require much finer
resolution terrain, the one-meter resolution altimetry data from a LIDAR survey
of downtown Baltimore was furnished. Higher-resolution altimetry data is also
available for more accurate calculations. A segment of the Baltimore Inner
Harbor altimetry data centered around the Baltimore Convention Center is shown
below with the harbor to the lower-right and Camden Yards to the lower-left.
Atmospheric
data was collected from a weather prediction website. The resulting altitude
and direction dependent sound speed is shown in the Noise-Con conference
proceedings associated with this paper.
An
altimetry cross section (blue curve in the top panel of the next figure) from
home plate towards the pitchers mound crossing center field, the ivy wall, the
warehouse, and the train station is shown below with an accompanying plot of
the predicted sound transmission loss (red curve in the bottom panel of the next
figure) at a constant altitude of 20 m from ground level. As a reference point,
the black dash curve represents the transmission loss in the absence of
boundaries and atmospheric refraction (also known as free-field spherical
spreading). The higher interference pattern beyond center field qualitatively
demonstrates that the model indeed accounts for sound reflection and diffraction
between these anthropogenic landscape structures.
After
furnishing the speakers volume and background noise level, this portable
physics-based simulator calculates and displays the loudspeaker coverage in the
form of signal-to-noise ratio (SNR) at one meter above the local terrain
altitude. The SNR is a key indicator of broadcast understanding. A positive SNR
indicates that the sound may be distinguished from the noise. However, the SNR
must be several decibels (dB) above the background soundscape to ensure that
the broadcaster may be clearly understood. The next figure demonstrates
excellent coverage from a loudspeaker over home plate with significantly spotty
coverage outside the ballpark. Qualitatively, this result is in agreement with fan
observations.
Finally,
a demonstration of this portable loudspeaker coverage estimation system is
shown next. Note that the graphical user interface is intuitive, the
calculations take just a couple of minutes, and it is capable of storing all
generated figures into a single PowerPoint file ready for editing and reporting.
<juanarvelo5.mp4>