Glass Breakage
by Blasts - A Prediction Model and Real-world Validation
Louis C. Sutherland - lou-sutherland@juno.com
LCS Acoustics
Popular version of paper 3pNS2
Presented Wednesday afternoon, April 21, 2010
159th ASA Meeting, Baltimore, MD
It is not surprising that windows are usually the
structural element in a building most subject to damage by the overpressure
pulse from an explosion. After all, what
other building element can so easily be broken by a baseball hit by an unlucky
young batter in a neighborhood baseball game played too close to your home. A powerful statistical model for damage to
windows from similar impulsive pressure loads was developed in 1976 by R.L Hershey
and T.H. Higgins for the FAA in a study concerning
window damage from sonic booms. This model was used to predict the
statistical probability of damage to windows in an apartment complex exposed to
blast overpressure from a accidental explosion of a small, solid rocket motor undergoing
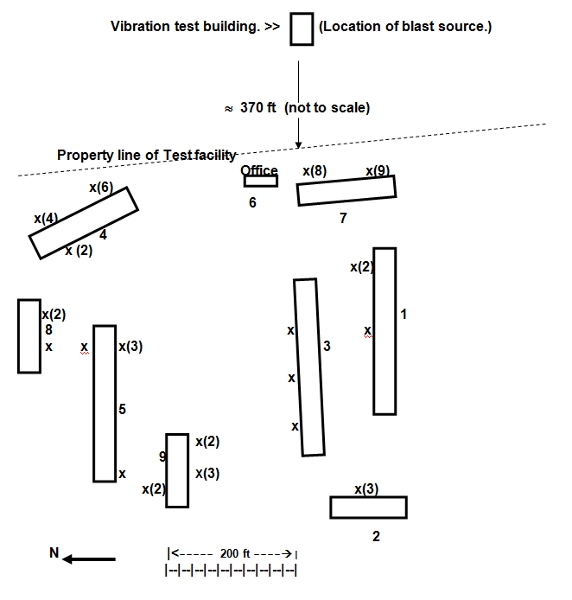
a vibration test in a nearby environmental test facility. The apartment complex consisted of 9
buildings with 738 windows located at distances of 430 to 980 ft from the blast
source as portrayed below in Fig. 1. The
windows faced different directions relative to the incident blast wave with
most of the 53 broken windows facing the blast source. Fortunately, no one was injured by this
blast.
This paper reviews the
blast loading on the windows which faced different directions relative to the incident
blast wave, the resulting blast-generated structural stress in the windows and
the statistical prediction of damage to these windows from this blast.
Based on the 20 lb weight of the rocket motor, a
knowledgeable explosions expert estimated the blast was equivalent to a charge
of about 30 lb of
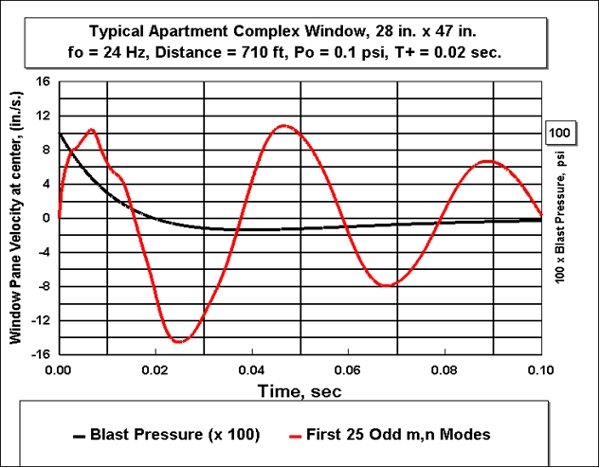
The expected time history of the pressure pulse from such a
The structural velocity at the center of the glass pane
exhibits the characteristic sinusoidal-type vibration expected for a structure
vibrating in all its resonant modes. The
fundamental frequency for vibration of the window pane was calculated to be 24 Hertz (cycles per second) for the 28 x 27 in.
window.
From well-verified blast prediction models, the peak
effective blast pressure at the face of this window, including a 2 to 1 blast
pressure reflection factor at the window surface, was estimated to be 0.2 lbs
per square inch. This corresponds to a peak sound pressure level of about 156
dB.

Figure
1. Geometry of Vibration test stand and the nine buildings of
the nearby apartment complex. The xs
designate the approximate location of the
broken windows and the number in
( ) indicates the number broken at his location. (No number indicates
just 1 window broken at the x location.)

Figure 2.
Time history of blast pressure and structural velocity at surface of a typical
window in the apartment complex due to the accidental explosion from 30 lbs of
The structural velocity
at the surface of the window panes is used to predict the dynamic stress in the
windows due to the incident blast wave. This utilizes a powerful relationship
between the peak stress, Spk in a sinusoidally vibrating structure
and its peak structural velocity, Vpk that was first developed by
the late Prof. F.V. Hunt in 1960. Essentially the relationship states that:
Spk = KS
[ Vpk,/ CL] psi
(1)
where
KS = a
vibration/stress proportionality factor dependent on the geometry of the
structure and Youngs Modulus of Elasticity, in psi of the material
CL = the longitudinal speed of sound, in the
material in in/s and
Vpk = the
peak modal velocity, in in/s.
(Note, that (Vpk/CL) could be
considered as a structural response Mach No.)
The peak structural stress, Spk varies directly
with the peak effective blast pressure, Peff acting on the window, the dynamic response
characteristics of the window, e,g, its resonance frequencies and its surface
weight all predictable quantities. The risk of damage to the window is defined
the Factor of Safety (FOS) involved in the window blast exposure of the window
to the blast. This FOS is simply the
ratio of the threshold for damaging stress, Sd for the window
material to the peak stress, Spk imposed by the blast or,
FOS = Sd / Spk (2)
All factors involved in
each of part of this ratio can be estimated in terms of their nominal value and
the standard deviation about this nominal mean value. The statistical
distribution of the stress threshold for damage of window glass was especially
well defined from extensive published data. The net result is that the Factor
Safety (FOS) also has a statistical distribution and a standard deviation, sFOS, which is the root
mean of the standard deviation of all the terms making up the ratio in Eq.
(2).
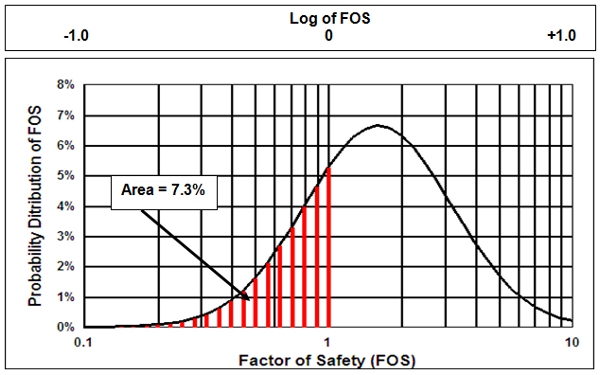
It turns out that the
logarithm of the FOS has, what is called a Normal Distribution that has the
haystack shape shown below. Damage to
a window is presumed to occur when ever the FOS is less than 1 or the Log of
the FOS is less than 0. Thus, the Probability of Damage (POD) for this
illustration is equal to the area under this normal distribution of the Log of
the FOS for which this Log is less than 0 which is 7.3 %, for this illustration.

Figure
3.
Illustration of normal distribution of
Log of Factor of Safety (FOS). Total Probability of Damage (POD) of 7.3 % is represented by the crosshatched area
under that part of the Lg[FOS] distribution for which the FOS 1 or Lg[FOS] is 0.
This prediction of the
POD for the windows in the Apartment Complex utilized well-known math models
for the Normal Distribution and statistical distribution data for all the terms
involved in Eq. (2), including model data,
not discussed here, on the change in effective sound levels on the
front, side and back of buildings simulating the blast wave reflection effects
for the windows in the Apartment
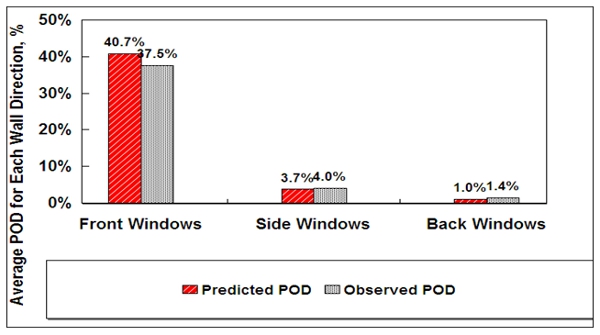
Complex. The average observed
and predicted POD for the windows on the front, side and back of the buildings
relative to the blast incidence direction are shown in Fig. 4 to be in good
agreement.

Figure
4. Average N-weighted, predicted versus observed POD for the
window orientation re: the blast direction for N = 80 front, N = 520 side and N
= 138 back windows.
The Fig. compares the average predicted and observed window failure rates for each of the three
window directions The agreement provides support for the basic validity of the
structural damage prediction model
employed for this study.