Ira Leifer– ira.leifer@bubbleology.com
Bruce Luyendyk – luyendyk@geol.ucsb.edu
Dan Culling - culling.215@gmail.com
Chris Stubbs - geostubbs@gmail.com
Igor Semiletov - igorsm@iarc.uaf.edu
University of California, Santa Barbara
Marine Science Institute
Santa Barbara, CA 93106
Popular version of paper 1a2b3c
Presented Monday morning, May 23, 2011
161st ASA Meeting, Seattle, Wash.
Marine bubble plumes originate from biological and petroleum-related sources (thermogenic) at the seabed and rise toward the sea surface transporting the potent greenhouse gas (GHG), methane, which is the second strongest GHG after water vapor on a 20-year time horizon. Although few values are available, marine thermogenic and hydrate-derived sources are estimated to contribute 12 percent of the global methane budget and 20-30 percent of the global fossil methane budgets annually; however, few measurements are available. Methane hydrates are a methane-ice that is stable in the deep sea. Warming oceans threaten this vast reservoir, particularly in the Arctic, where submerged permafrost methane bubbles also presents a significant GHG threat.
Flux estimates of these marine bubbles have been by boat-based sonar, ocean surface and sea floor direct flux-measurements, video, and geochemistry, all of which lack the ability to monitor bubble seepage if there are significant spatial variations. Yet, seepage has been documented to vary greatly in space and time. To provide this critical information, a sea floor, Rotating Sonar SCANner (ROSSCAN) was developed using multibeam technology. In sonar, the strength of the return sound can be used to better understand the target material. Multibeam sonar adds directional information, which removes significant potential confusion when studying marine bubble plumes with sonar.
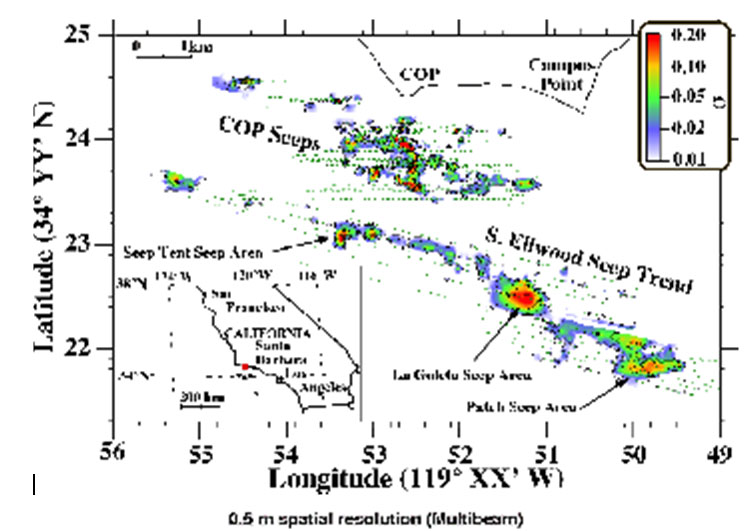
ROSSCAN was developed and tested in the laboratory and then deployed in the Coal Oil Point seep field, offshore California, which releases ~100,000 m3 of methane per day from seeps spread over 18 km2 of seafloor. ROSSCAN deployment was at Shane Seep (Fig. 1A) where towed multibeam sonar surveys revealed fine-scale detailed bubble plume structures (Fig. 1B), vastly better than previous single beam sonar survey studies (10,000 times better data).
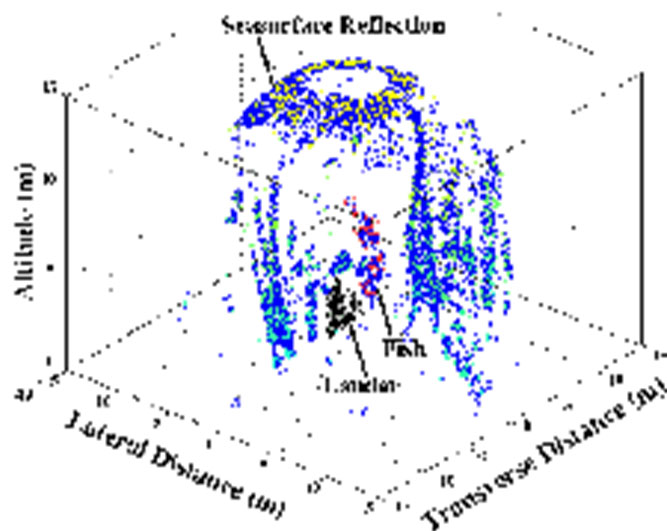
Fig. 1A Single beam, sonar return, s, map of seep plumes in the Coal Oil Point (COP) seep field, Santa Barbara Channel, California. Inset shows southwest US. From [Leifer et al 2010]. B. Multibeam sonar return map in a 2-meter thick, bottom-following window of the Shane Seep area.
The location and strength of the hydrocarbon seep bubble flux is controlled by geology – the higher the bubble flux, the greater the permeability and/or shallow reservoir pressure feeding the seepage. Meanwhile, the influence of waves and surge induce changes in the bubbling rate, allowing repeat sonar mapping to probe subsurface processes and controls. Repeat, vessel surveys are challenging, requiring significant time and expense, hindering observations on short timescales.
One area where methane bubble emissions are of particular concern is the East Siberian Arctic Sea (ESAS), where vast deposits of methane lie trapped under subsea permafrost. Here recent studies show extensive (spanning for order of 1000 km scale) areas of bubbling, suggesting permafrost integrity loss that could relate to rapidly warming Arctic oceans. As Arctic oceans warm, these permafrost methane deposits will be increasingly at risk of destabilization increasing their contribution to global methane budgets.
In 2008, as part of an ESAS survey mission, ROSSCAN (Fig. 2) was deployed and observed bubble plumes. ROSSCAN was set to rotate 300 degrees about a vertical axis (leaving a blind spot) and documented strong bubble flows, including typical bubble plume features like bending from currents in the upper water column. The dome feature that is most prominent at the image top is the sea surface reflection, which has been suppressed slightly in this analysis. Further data analysis will investigate the relationship between bubble emissions and environmental factors like waves and tides.

Fig. 2. Sonar-scanner data (10-min average) from 2009 ESAS cruise, showing spatial distribution of bubbles and a school of fish. 3D rotation movie at http://www.bubbleology.com/private/SonarRotator.avi