David Griesinger - dgriesinger@verizon.net
David Griesinger Acoustics
221 Mt Auburn St
Cambridge, MA 02138
www.davidgriesinger.com
Mobile: 617 331 8985
Popular version of paper 1aAA14
Presented Monday morning, October 31, 2011
162nd ASA Meeting, San Diego, Calif.
Clarity of sound is a simple concept that resists definition or measurement. The author proposes that it is possible to both define and measure clarity through the ability to separate one sound from another – such as separating the onset of speech syllables from noise and reflections that obscure their meaning, or separating the sounds of two people talking at the same time. For example, when clarity is high we can choose to listen to any one of several simultaneous conversations in a crowded room, but this ability disappears along with clarity if the room is overly reverberant. In a concert seat with clear sound the author can precisely localize and follow at least three instrumental lines with eyes closed. In a seat just a few rows further back the music blends together.
The inner ear, the cochlea, mechanically filters sound into many overlapping frequency bins each about a third of an octave wide. The most important of these bins span the frequencies of about 1000Hz to 4000Hz, where the identity of a sound source such as you, me, a violin or a viola, and the sound of a vowel, is determined by the relative strength of the sound in these bins. These frequency bins, the most sensitive in human hearing, are the first to be damaged by impulsive sounds.
Most of the sound in these bins consists of multiple high harmonics of a low frequency fundamental. Male speech has a fundamental frequency of about 125Hz, which means that the 1000Hz third-octave bin contains about three harmonics, the 2000Hz bin contains six, etc. The sonic difference between my voice and yours, the vowel “a”, and the vowel “o” lies in a particular pattern of the sound strengths in each bin, patterns that for speech are created by resonances in the vocal tract. These patterns are called color or timbre, and are independent of the fundamental frequency. A violin sounds like a violin whether it plays a C or an F, and we all hear the same vowels, regardless of the pitch of our voice.
This standard view of hearing can explain our ability to understand a single person or instrument. It does not explain our ability to understand simultaneous conversations, the effects of reflections, our ability to perceive near or far, or our acute sensitivity to pitch. With this model if two people talk at once the sound strengths in each bin are a mixture of “you” and “me”, and “a” and “o”. Neither the identity of the speaker nor the vowel should be easily determined. But in clear acoustics two simultaneous monotone speakers with a pitch difference of only one twelfth of an octave (a semitone) can be identified, understood, and localized with just one ear.
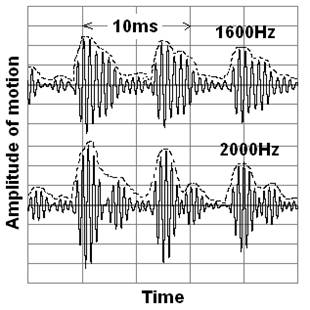
The author hypothesizes that two previously neglected features need to be added to the standard hearing model above. First – in our model the bins in the cochlea not only detect the overall strength of the sound inside them, but also detect fluctuations in this strength at the frequencies of the fundamental pitches. Once in each fundamental period harmonics in a particular high frequency bin align in phase to create a pulse similar to the original pulse, such as the opening of the vocal cords. The higher the frequency of the bin the more harmonics it contains, and the more low frequency harmonics of the tone are present in the fluctuations.
|
|
Second – we hypothesize that these fluctuations can be separated by their pitch into two or more independent neural streams by neural filters in the brain stem, each formed by adding together about 40 delays separated by the period of the fundamental frequency. Fluctuations with a pitch-period that corresponds to a particular neural filter add together, and other pitches are rejected. We believe the ear contains enough neural filters to separate each cochlear bin into 30 to 100 pitches.
Humans hear the pitch of tones separated by an octave as essentially the same, and this is one of the properties of the neural filter presented above. The physics of information tells us that such a filter must be about a tenth of a second in total delay if it is to achieve the one part in a thousand pitch acuity of a musician. From this we predict that if the direct sound dominates the reflections in the first tenth of a second we can separate a sound from reverberation.
In our model timbre, the high frequency sound strength patterns that determine the identity of a source and its vowels, is detected AFTER sounds are separated by pitch by comparing the strength of the fluctuations at a particular pitch across all the high frequency bins. Location is found in a similar way. This process is identical to the standard model, except instead of looking at the overall strength in each bin we are looking at the strength of the fluctuations at a particular pitch.
This system evolved because the neural filter is far sharper than is mechanically possible. It removes most environmental noise, instantly tells which sounds are close to the listener and which can be ignored, and allows the listener to choose to listen to one of many close sources. It also allows us to hear the complexity of music.
Our model offers a new explanation of the confounding role of sound reflections, such as in a too-reverberant dining room where no one can be understood: reflections randomize the phases of upper harmonics, and when there are too many reflections coming too soon simultaneous sound sources can no longer be separated or precisely localized. Physics allows us to calculate or measure the degree of randomization.
The author has developed a simple method of measuring the clarity available in a particular spot in a room. Starting with a binaural impulse response, the method compares the strength and timing of the direct sound relative to the reflections that follow, and predicts whether or not the direct sound is strong enough to separate and localize simultaneous sound sources. The goal is to aid the design of music halls, concert stages, and classrooms. Even when no binaural impulse response of an occupied hall is available, a binaural recording of a live sound may be used to predict whether or not instruments or speakers can be independently heard. With this model we may soon have an app that measures clarity as music plays.
A few audio examples can be heard at: "Audio Examples of Clarity and Pitch Separation"
P.S. After writing this summary the author found a 2002 paper by Peter Cariani that noted the existence of the fluctuations shown in figure one, and suggested that a filter following their detection should have the properties of a comb filter. The author of the paper summarized here believes that although comb filters have not yet been observed in the brain stem, the evidence for them is compelling. He proposes that level fluctuations due to the phases of harmonics and subsequent highly frequency selective neural filters enable our ability to separately detect pitch, timber, location, and distance of simultaneous sound sources – and consequently determine the perception of clarity.
The author welcomes questions on this subject.
Code for calculating the localizability of a source from a binaural impulse response is on the author’s web-page, along with details of the auditory model.