William M. Hartmann - hartman2@msu.edu
Department of Physics and Astronomy
Michigan State University
East Lansing, MI, 48824
Popular version of paper 4pPP1
Presented Thursday afternoon, 3 Nov. 2011
When a cello plays the musical note called "G below middle C," a tone is produced with a vibration frequency of about 200 cycles per second or 200 Hertz (Hz). However, 200 Hz is not the only frequency in the tone. The spectrum of the sound includes harmonics: 400, 600, 800 Hz, and so on indefinitely. The single most important fact about this tone is that the harmonics are not heard individually. Instead, the harmonics are integrated by the human auditory system into a single perceptual entity with a pitch (200 Hz) and a tone color. This perceptual integration is especially remarkable because the first step in the human processing of a tone is to separate the harmonics into different channels. The mechanics of the inner ear separates sounds so that different frequencies excite different neural pathways in the brain. This separation by frequency -- maintained throughout the auditory system -- is known as "tonotopic analysis." But because tones with harmonics are heard as single entities, the process of tonotopic analysis has to be undone somehow. Something in the auditory system has to put the analyzed components of the tone back together again. This is the process of integration.
If a second musician joins the cello player and plays the note called "B," with a frequency of 247 Hz, a listener will hear two tones. (Together, the G and the B make the interval of a musical "third"). Somehow, the B is not integrated with the G; instead, it is perceptually segregated. What's remarkable about that is that the frequency 247 Hz is so close to 200 Hz that many harmonics of the two tones fall into the SAME neural channels.
We face a paradoxical situation: harmonics that are analyzed into different tonotopic channels become integrated into a single perceived entity whereas two tones that share the same tonotopic channels become segregated into two different perceived tones. Evidently something beyond tonotopic analysis is involved. The new element is neural synchrony. The sensory cells of the inner ear preserve the timing of the sound vibrations. With timing preserved, one can talk about neural synchrony. The different harmonics of the C note are synchronized with one another. The different harmonics of the G note are synchronized with one another too, but the harmonics of the C and the harmonics of the G are imperfectly synchronized if at all.
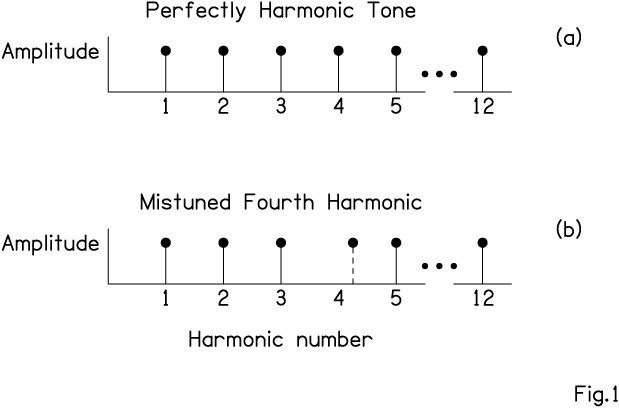
The goal of the research presented today is to understand how neural synchrony integrates and segregates tones. The research method is mistuned harmonic detection (MHD). A MHD experiment measures the amount of asynchrony needed for a listener to hear two tones rather than only one. We begin with a 200-Hz complex tone from a cello with a dozen harmonics (Fig. 1a); the listener hears just one tone. Next, we use computer techniques to mistune the 4th harmonic of the cello tone from its normal frequency of 800 Hz to some slightly higher frequency (Fig. 1b). If the 4th harmonic is mistuned enough, the listener hears it pop out as an independent, segregated tone, like a flute playing the double octave above the cello.
In a typical MHD experiment, a listener hears a sequence of two tones. One tone has perfectly tuned harmonics such as integer multiples of 200 Hz; the other has a mistuned harmonic. The listener's task is to say which has the mistuned harmonic.
Because it is so simple and well controlled, the MHD experiment is a powerful method for studying integration and segregation. It is important to know that detecting a mistuned harmonic is not just a matter of recognizing that something is out of tune because it has the wrong pitch. Detecting a mistuned harmonic is much more sensitive than that, as can be shown by putting the mistuned (or not mistuned) harmonic in one ear and all the other harmonics in the other ear. Success in detection evidently depends on a direct peripheral interaction between the mistuned harmonic and the other components of the tone.
Curiously, listeners are much better at detecting mistuned harmonics if the intensity of the signal is rather low. Figure 2 shows the ability to detect a mistuned 4th harmonic for five different listeners. Best detection occurs between 25 and 40 decibels (dB). For higher intensities, like 55 dB, detection drops sharply. That is an unusual result. There are very few auditory abilities that get worse as the intensity rises above 40 dB. However, a physiological analog has been found in animal experiments. Experiments with harmonic tones found that at low intensities like 30 dB, the neurons of the chinchilla auditory nerve synchronized to several harmonics, but as the intensity was increased to 55 dB, the synchrony was entirely dominated by only one harmonic, as selected by tonotopic analysis. The parallel with a listener's ability to hear out a mistuned harmonic is perfect. The ability of a neuron to synchronize to multiple frequencies allows the identification of asynchrony that mediates the detection of a mistuned harmonic.
If the physiological analog is valid, the neural synchrony involved should be tonotopically local. It should not depend on all the harmonics across the entire frequency range. But if the relevant synchrony is local, then mistuned harmonic detection should be dramatically affected by local changes in the stimulus spectrum. Suppose we attempted to detect a mistuned 4th harmonic in a tone where there is no 3rd or 5th harmonic (Fig. 3). Then the only way to detect the asynchronous 4th harmonic comes from the weak interaction with more distant neighbors, the 2nd and the 6th. Then mistuned harmonic detection ought to be much poorer. On the other hand, detection should not decrease as rapidly as the intensity is increased because an increase in intensity expands the excitation from the region of the 4th harmonic towards the region of the 6th.
In fact, this is what is found experimentally, as shown in Fig. 4. For a 4th harmonic mistuned by 2.5 percent, detection is poor with no 3rd and 5th, but there is much less of a peak in the detection score as the intensity increases.
If a mistuned harmonic is segregated by its asynchrony then detection ought to depend on the dephasing of the mistuned harmonic with respect to its neighbors. Dephasing is the product of the duration of the tone multiplied by the amount of mistuning. Fig. 5a shows detection ability for different amounts of mistuning and for two different tone durations, 30 ms and 50 ms. Fig. 5b shows the same data, but plotted against the product of duration and mistuning. The coincidence of the plots for different durations shows how the
dephasing concept unifies the results.
The experiments described in this report are just a few of many attempting to understand the processes of tone integration and segregation.
FIGURES:
FIG. 1: Spectra for two tones. The tone in (b) has a mistuned harmonic.
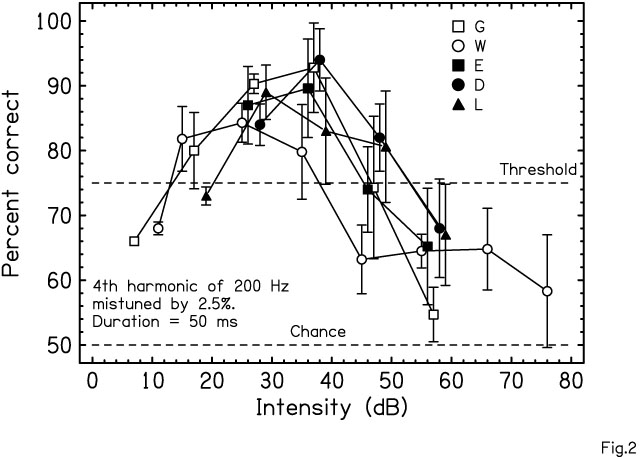
FIG 2: All five listeners detect a mistuned 4th harmonic best at low sound intensities.
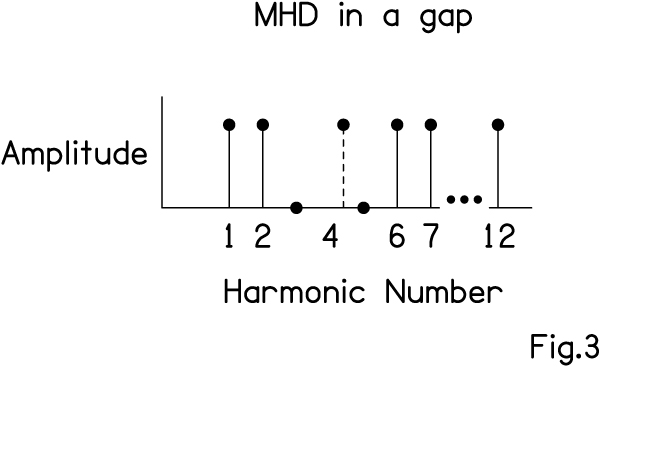
FIG 3: A tone spectrum with a gap around the mistuned 4th harmonic.
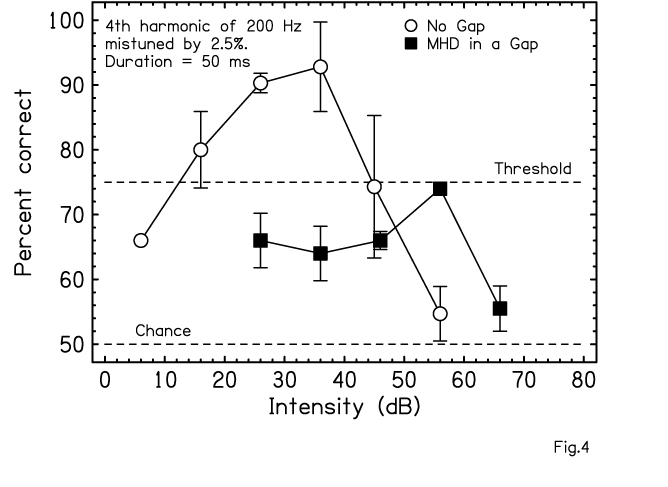
FIG 4: With no 3rd or 5th harmonics (squares) detection is much worse than when all harmonics are present (circles).
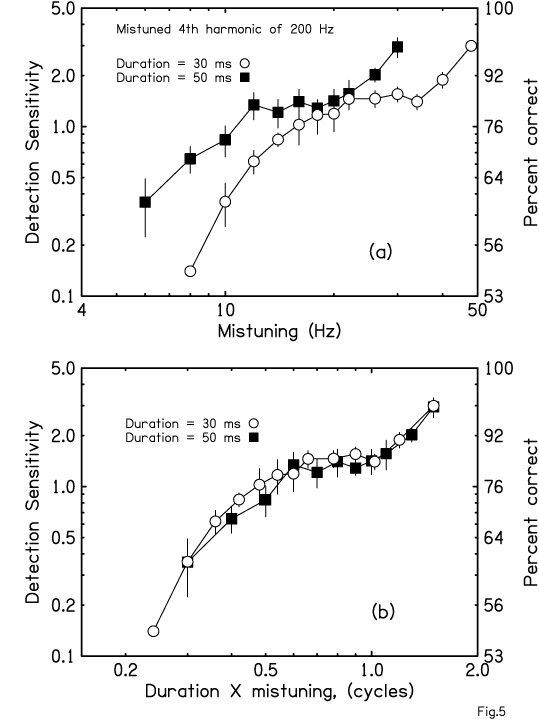
FIG 5: Part (a) shows that mistuned harmonic detection is better for longer duration. Part (b) shows the same data plotted against the dephasing parameter.