Fig. 1: Sources and types of vehicle noise
Fig. 2 : Transfer path of vehicle NVH
Jin-Su Park – jinsu96@naver.com
Chang-Yong Jeong
Un-Chang Jeong
Jae-Eun Jeong
In-Hyung Yang
Jae-Eung Oh
Noise and Vibration Control Laboratory
Hanyang University
Seoul, Korea
Popular Version of Paper 2pSA8
Presented Tuesday afternoon, May 15, 2012
163rd ASA Meeting, Hong Kong
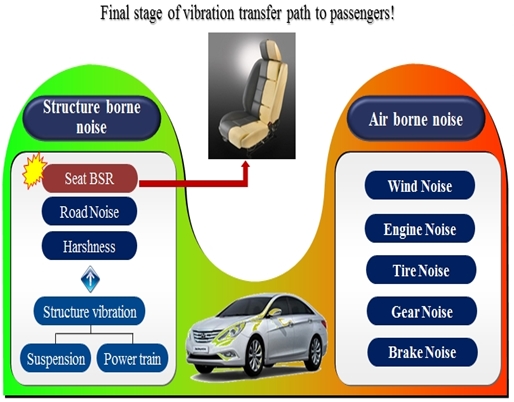
Vehicle noise (NVH) is becoming the most important factor to customers. Especially the seat, which is the final stage of vibration transfer path to passengers from all sources of vibration like the engine, transmission, suspension, etc. Recently, concern about BSR (Buzz / Squeak / Rattle) noise of a vehicle seat caused by quality issues or interference and friction between each component is increasing. In other to reduce the BSR noise of a vehicle seat effectively, it is important to find noise sources exactly by evaluation of experimental vibration data. However, this process is not easy because there are many noise sources that correlate with each other. So it was necessary to research signal processing techniques for distinguishing and identifying major factor of noise sources. For this reason, in this study, evaluation of vibration about seat rattle noise below 2000Hz frequency range known to be a problem of seat BSR was performed by using coherence function technique.
|
|
Fig. 1: Sources and types of vehicle noise |
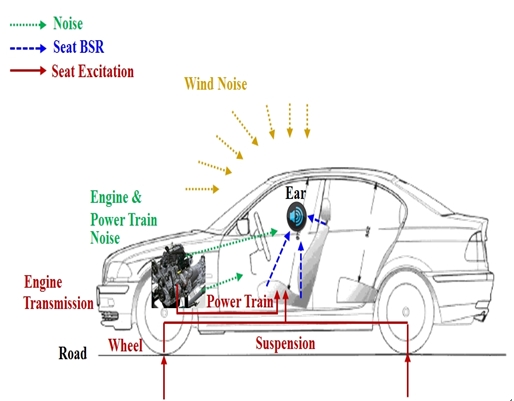
Fig. 2 : Transfer path of vehicle NVH |
A frequency response function (FRF) method was used to analyze the Multi-Input Single Output (MISO) system. However, the FRF method is usable only in the case that input sources do not influence each other. Therefore, Multi-Dimension Spectral Analysis (MDSA) was applied, which can diminish the influence among the input sources and determine how each input factor contributes to output noise.
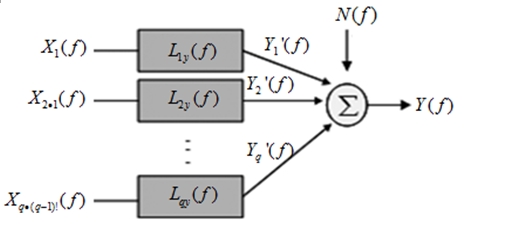
Fig. 3 shows conditioned MISO model eliminated correlation between inputs by optimal transfer function that is represented the ratio of output for the pure input. And Fig. 4 shows how ordered conditioned auto-spectrum (pure input that correlation is removed among inputs) is obtained from the original auto-spectrum.
 |
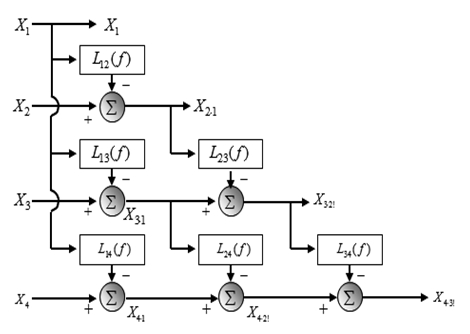 |
Fig. 3: Conditioned multiple input/single output model |
Fig. 4: Conditioned 4-input modeling for output model |
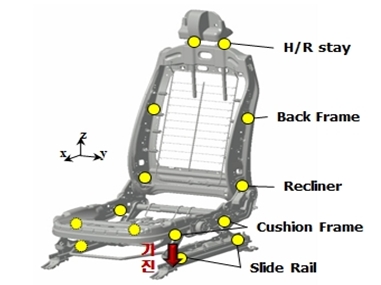
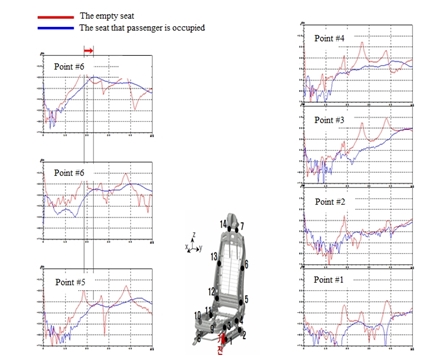
Modal testing is a commonly used method to evaluate the vibration characteristics of mechanical structure. In this study, modal testing used impact hammer and six-axis simultaneous hydraulic exciter was performed to evaluate the vibration characteristics of the driver's seat focused on whether a passenger is occupied or not. To perform the modal testing of full car by impact hammer, the vehicle seat was four-point bolted on the floor of midsize sedan. In case of modal testing used exciter was bolted on JIG. Each bolting torque of mounting bolts that assembles the seat and floor, were set to assembling torque in a full car manufacturing line. And 14 tri-axial accelerometers attached to each position of the seat frame in Fig. 5. Fig. 7 shows Frequency Response Function (FRF) at each measurement point as result of modal test, and through the analysis of FRF, frequency mode map of vibration was expressed in Fig. 8.
 |
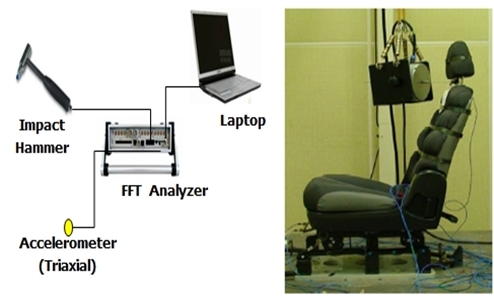 |
Fig. 5: Measurement point of modal testing |
Fig. 6: Measurement set up for modal testing used impact hammer and exciter |
 |
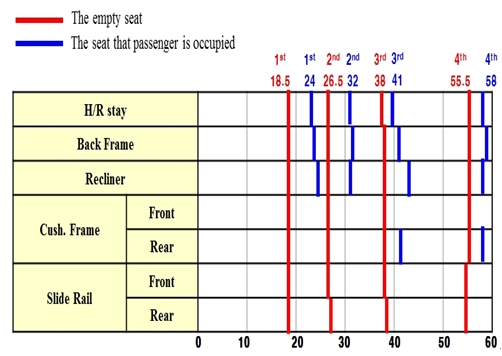 |
Fig. 7: FRF at each measurement point of modal test |
Fig. 8: Frequency mode map of vibration in vehicle seat |
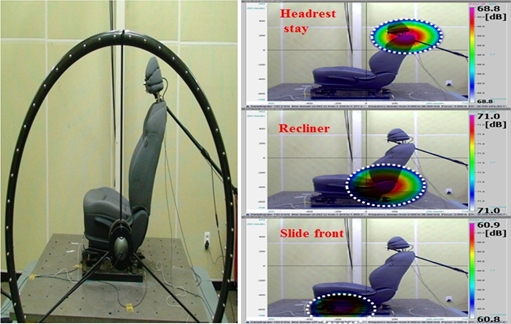
To find the location of rattle noise due to the vibration characteristics of the vehicle seat and to select the input source, noise source was visualized. The six-axis simultaneous hydraulic exciter and sound camera that microphone array with ring type 48 channels is applied was used to measure. Visualization of noise was performed in frequency range of 0~2000Hz, including a range of rattle noise occurrence (Fig. 9). As shown, BSR occurred in slide front, recliner, headrest stay and those were selected as the input of multiple input/single output model. Based on the results of noise source visualization, to examine the rattle noise of driver's seat, the measurement about noise and noise sources was performed in the driver's ear position. In position of close measurement, headrest-stay was divided into upper and lower part and these sections were measured. Because rattle noise can be occurred due to the clearance between the guide and headrest stay and also to shake headrest itself.
 |
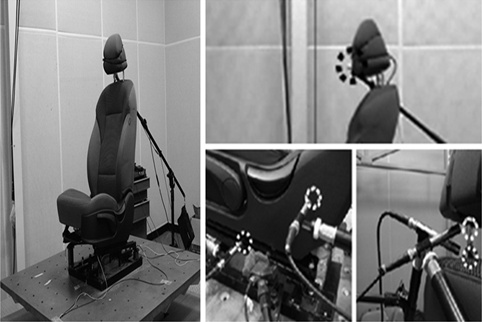 |
Fig. 9: Visualization of sound source localization |
Fig. 10 : Experiment setup of sound pressure mesurement |
From the result of sound pressure measurement, frequency of 58Hz has greatest peak value in seat noise. And cross-correlation between inputs or input/output signals can be checked by Ordinary Coherence Function (OCF), the value of OCF between input and output signal is also highest in 58Hz. After re-ordered input sources based on the value of OCF between input and output in 58Hz, multi-dimensional spectral analysis was performed. The multi-dimensional spectral analysis consists of the Partial Coherence Function (PCF) and the Multiple Coherence Function (MCF). The PCF represented as a pure coherence of input from output and The MCF is defined that the transmitted power ratio from considered inputs of output power. The MCF can be a judgment criterion for all inputs that is affected to output.
The value of the partial coherence function and multiple coherence function in 58Hz is shown in Fig. 11. and Fig 12. And the order to contribute significantly to the output is as follows: lower part of headrest stay > slide front > upper part of headrest stay > recliner.
Through the value of the PCF, the lower part of headrest stay had a very higher contribution than other inputs in 58Hz, so it was considered as major factor to the output.
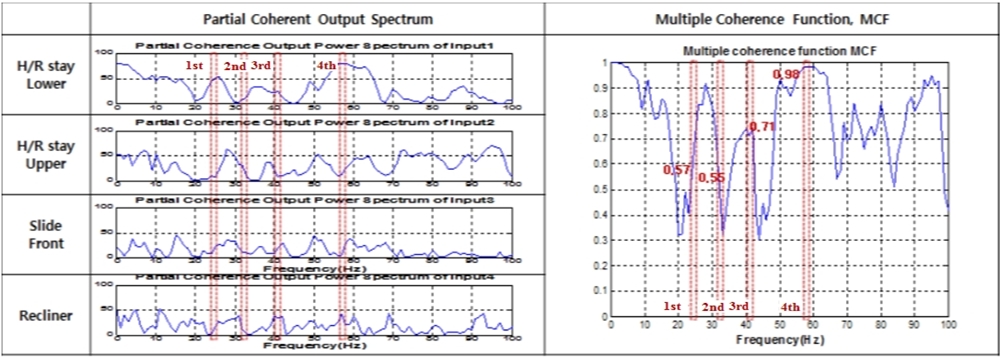 |
Fig. 11: Partial coherent output spectrum and Multiple coherence function |
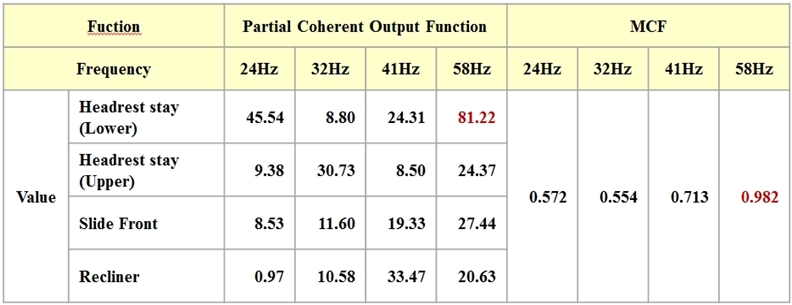 |
Fig. 12 : Data of Partial Coherent output function and Multiple coherence function in 58Hz |
In this study, coherence function method is used to rattle noise sources that are confirmed as a visualization of noise source in seat. A net contribution of each noise source is confirmed under eliminated correlation between inputs using coherence function method. Finally, we can get the conclusion as follows:
1) Rattle noise is generated in headrest, recliner and a front position of slide when the seat is oscillated as a white noise.
2) A target frequency is selected at 58Hz as considered rattle noise based on measured noise at a driver position shows high level at 50~100Hz.
3) As a result of estimation of contribution with respect to noise sources at 58Hz as a target frequency, it is confirmed that rattle noise is generated at bottom of the headrest.
4) By modal testing, it was confirmed that rattle noise of 58Hz was occurred due to the vibration characteristics of the seat.