Figure 1. Animation of a sound source producing motion of imperfections within an optical fiber. Movement of the reflectors is exaggerated and the figure is not to scale.
Emery M. Ku – emery.ku@optasense.com
Gregory L. Duckworth – gregory.duckworth@optasense.com
OptaSense
27 Moulton Street
Cambridge, MA 02138
Popular version of paper 3aUWa1
Presented Wednesday morning, June 5, 2013
ICA 2013 Montreal
What is a fiber optic Distributed Acoustic Sensor?
The OptaSense® Distributed Acoustic Sensing (DAS) technology turns standard telecommunications optical fiber into thousands of “virtual microphones” capable of monitoring up to 50 linear kilometers per system (1). These microphones are analyzed in real-time to provide situational awareness for safety and security across a wide range of industries. Fiber optic cables that have already been deployed in the ground can be re-purposed to provide high reliability, low cost-per-km monitoring solutions.
How is DAS used?
OptaSense® has been successfully deployed in over 35 countries to serve industries including: oil and gas; military and government; and transportation. Some specific examples of uses are: detection of third party intrusion into- and leakages out of- oil and gas pipelines; downhole monitoring of hydraulic fracturing operations; detection of unauthorized crossings of critical asset perimeters and national borders; monitoring of railways for safety and security; and vehicular traffic flow monitoring and accident detection along highways.
In many cases, DAS is replacing traditional technologies or providing a unique solution that was never before possible.
How does DAS work?
DAS works by sending out short pulses of laser light down an optical fiber. A small amount of light reflects backwards off of natural imperfections distributed throughout the glass and is received by a sensitive photodetector to create “virtual microphones”. This process is similar to the way underwater sonar works – i.e. where an acoustic ping is sent out, reflects off of distant targets and is received by a hydrophone.
When sound waves travel through the ground, air or water, they stretch or strain the fiber optic cable and the imperfections in the glass core move back and forth. The light that is reflected from these ‘mirrors’ will change as a result. How quickly each sensor can listen for changes is limited only by the time required for a pulse of light to go all the way down a fiber and back—1/2000th of a second for a 50 km cable, for instance. The width of- and spacing between- each “virtual microphone” is configurable, but a typical value for both parameters is 10 meters.
Figure 1 is a cartoon illustration of how reflectors inside an optical fiber move when exposed to an acoustic source. Note that although groups of reflectors appear to be traveling forever to the right, individual reflectors are moving back and forth. Each virtual microphone is comprised of millions of imperfections as the pulse of light is much wider than a single reflector. The combined response of all of these ‘mirrors’ provides a sensitive measurement of the local sound field.
Figure 1. Animation of a sound source producing motion of imperfections within an optical fiber. Movement of the reflectors is exaggerated and the figure is not to scale.
Tracking human walkers
It is often desirable to know where an intruder is relative to a protected area or asset. An ideal security system would be able to track a target prior to, during and after a boundary crossing. OptaSense® is able to do this by combining the received signals from multiple channels corresponding to individual footfalls.
In Figure 2, an animation shows how the signals received by a line of sensors change when the source location varies. The curvature of the signals over space and time is referred to as the normal moveout (NMO) in exploration seismology. By summing the signals up across different NMO curves over space and time, it is possible to build up a probability map of where in space each footstep originated; this technique is commonly referred to as ‘beamforming.’
Figure 2. Left pane illustrates the spatial arrangement of a line of sensors relative to a source. Right pane shows the signal received by each sensor. For the purpose of this illustration it is assumed the speed of sound is constant and there is no decay in the signal amplitude.
Figure 3 shows the result when walking data from OptaSense® is beamformed. Individual footfalls are shown as red circles with a black fill. For this dataset, the individual was walking diagonally from the pond in the upper left toward the bottom structure to the right. In the full animation, a color-coded probability map is displayed for each of the footfall localizations and fades away with time.
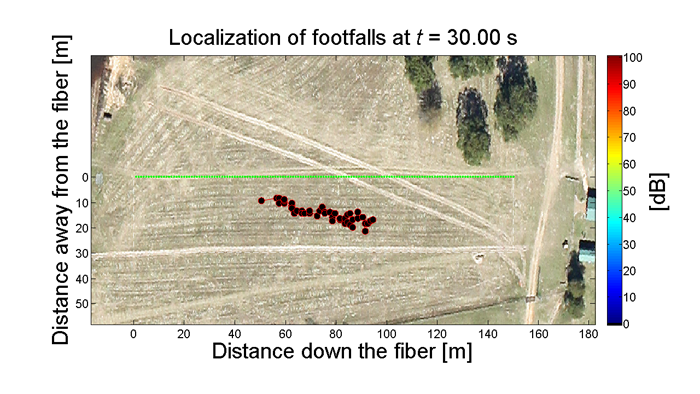
Figure 3. Localized footfalls. The full animation can be downloaded from this link.
With OptaSense®, standard telecommunications fiber optic cable can be used to localize walkers using the same techniques applicable to traditional ground sensors. The significant advantages DAS brings to the table are its range, the high spatial density of acoustic sensors and low cost-per-km.
References