Daniel J. Mennitt – daniel_mennitt@partner.nps.gov
K.M. Fristrup – kurt_fristrup@nps.gov
Lisa Nelson – lisa_l_nelson@nps.gov
National Park Service
Natural Resource Stewardship and Science
Fort Collins, CO 80525
Popular version of paper 4aNS5
Presented Thursday morning, December 5, 2013
166th ASA Meeting, San Francisco
Noise is increasing across the United States and worldwide
Since 1970, road traffic has tripled and air traffic, both passenger and freight, has grown faster than surface transportation. Multinational scientific studies of public health and noise have revealed that a significant fraction of the United States and European populations is suffering chronic health consequences from noise exposure. Noise impacts are not limited to developed areas, or people alone. One aircraft can broadcast audible noise up to 40 km from its flight path, and a loud truck or motorcycle can cast noise up to 10 km from a road if there is no intervening terrain. Many protected natural areas enjoy extremely low background sound levels, and distant noise sources degrade otherwise outstanding listening conditions for wildlife and visitors. The bioacoustic sounds present in an environment are good indicators of ecosystem health and the increasing pervasiveness of noise is a threat to ecological integrity. Anthropogenic, or human caused, noise can have direct consequences to wildlife fitness by impairing communication, elevating stress levels, and reducing breeding success.
The distribution, development, and abundance of transportation and other human activities calls for noise monitoring and management capabilities that span regional and national scales. Noise mapping efforts are increasing rapidly - a recent European Union directive has motivated the production of continental scale noise maps. In order to facilitate comprehension, proactive management, and effective mitigation of noise pollution on regional scales, additional tools are needed. Noise impacts are always evaluated in the context of ambient conditions, so some method of predicting what background sound levels would be in the absence of noise is required. Furthermore, alternative methods for predicting noise levels in terms of generic descriptors of human density and activity are needed for scenarios that involve an uncountable number of noise sources, or noise sources whose numbers and spatial distributions not have been quantified.
A geospatial sound model can be used to assess conditions on the national scale
Using long-term sound pressure level measurements from hundreds of sites across the contiguous United States, geospatial sound models have been developed to predict acoustic conditions. These models do not directly apply the physics of sound propagation or characteristics of individual sound sources. Instead, a geospatial sound model incorporates spatial representations of biological, geophysical, climatic, and anthropogenic factors to regress expected contributions to the existing sound pressure level from both anthropogenic and natural sources. For the results discussed herein, relationships between the acoustic and geospatial data were discovered and applied using Random Forest, a tree-based machine learning algorithm. Methods have been devised to determine the geospatial data relevant to an individual acoustic metric and one-third octave band, to interpret the resulting models, and to predict acoustical conditions across large areas.
Existing sound pressure levels
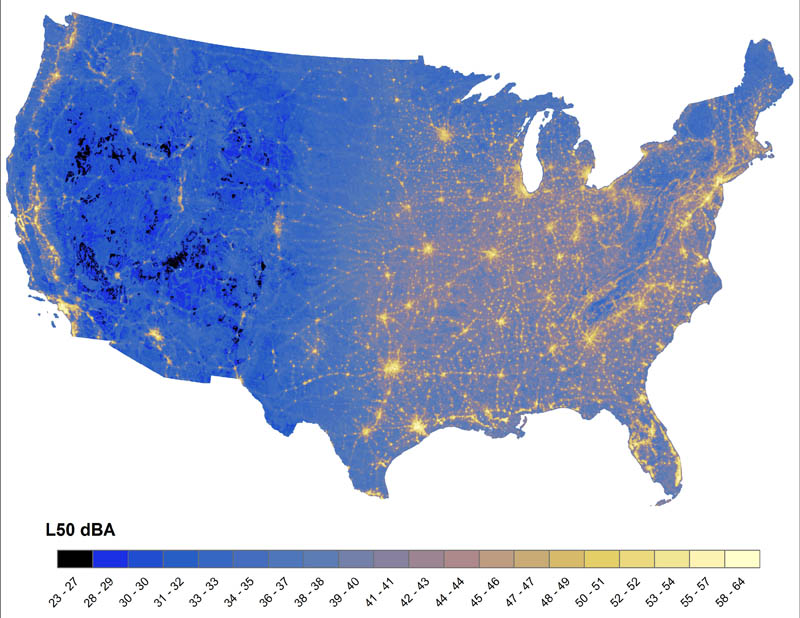
The following map shows the existing A-weighted L50 sound pressure level during a typical summer day as predicted by the geospatial sound model. The L50is the sound level exceeded half of the time whereas A-weighting is an adjustment that reflects how the human ear perceives sound.
Fig. #1: The existing A-weighted L50 sound pressure level as predicted by the geospatial sound model.
From this broad perspective, the most apparent features are the location of major US cities and the interstate highway system that connects them. These are the loudest areas of the country, and the pattern is driven most strongly by anthropogenic factors that describe industrial development and distance from transportation networks. The map bears a striking resemblance to recent Visible Infrared Imaging Radiometer Suite (VIIRS) data from NASA. Whereas undeveloped areas may be absent of radiated light they are not absent of sound. Biological and geophysical sources are also included in the existing sound level, although the spatial signatures of natural sources are overshadowed in much of the country at this resolution.
Natural sound pressure levels
The existing sound pressure level is the condition as measured; it includes all acoustic energy. A natural scenario was created by systematically manipulating the anthropogenic variables at each grid point. For example, the variable describing the proportion of developed landcover was set to zero and the distance to the nearest major road was set to the farthest possible value. Overall, the range of expected levels is much reduced compared to the existing sound pressure levels.
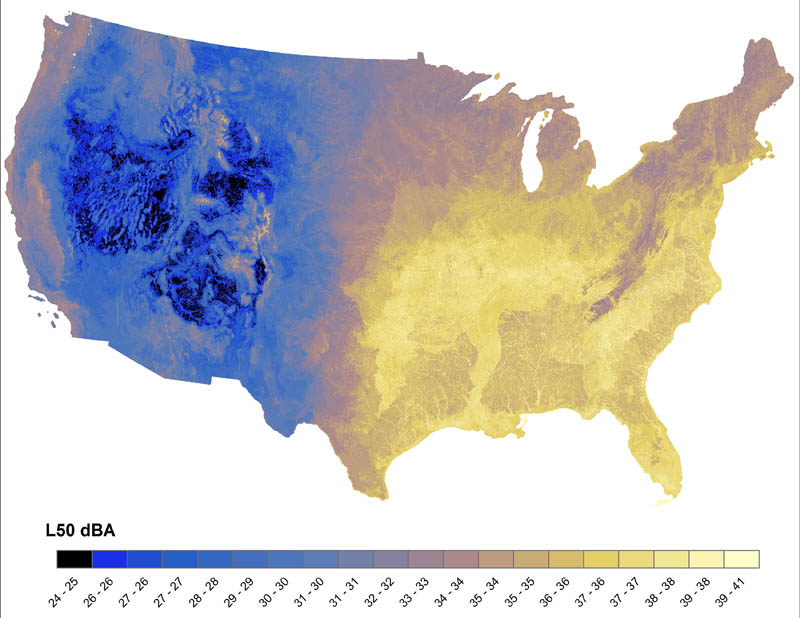
Fig. #2: The expected A-weighted L50 sound pressure level due to natural sources only.
Around the globe, the presence of life and consequently sound is driven primarily by latitude and moisture. Likewise, climate has a dominant effect on the magnitude of natural sound in the contiguous United States. The highest sound pressure levels are found in the southeast, mostly a result of flowing water, wind induced vegetation sounds, precipitation, and bioacoustic energy. The area surrounding the Mississippi river stands out, characterized by wetland landcover, low elevation, and proximity to rivers. Climate, and the resulting precipitation, open water, and landcover, largely defines the acoustical conditions across the United States. The eastern half of the country is characterized by wetlands and deciduous forest cover, which, in addition to wind induced vegetation sounds, also supports more insects and wildlife than other landcover types. The quietest places in the west are areas of dry, high elevation shrubland and barren, flat terrain.
The anthropogenic noise impact
A measure of impact can be defined as the difference between the existing and natural sound pressure levels. Densely populated and industrialized areas suffer the highest impact, elevating the existing level up to 32 dBA. While the eastern United States is the most heavily developed, almost the entire country is affected by anthropogenic noise. Unfortunately, the quietest areas are the most susceptible. Whereas high altitude aircraft may not be noticed in a bustling urban area, the noise adds appreciably to the stillness of an otherwise quiet wilderness. Pervasive flight traffic coupled with an extensive road network eliminates natural quiet across almost the entire country. There are some large concentrated areas of low impact, notably the Adirondack Mountains in northern New York state and portions of the Rocky Mountain Range in western states. However, most of the low impact areas are fragmented by transportation networks. In general, protected lands and lands not suitable for agriculture have a reduced level of impact. Roughly half of the low impact area occurs in designated recreational or conserved lands.
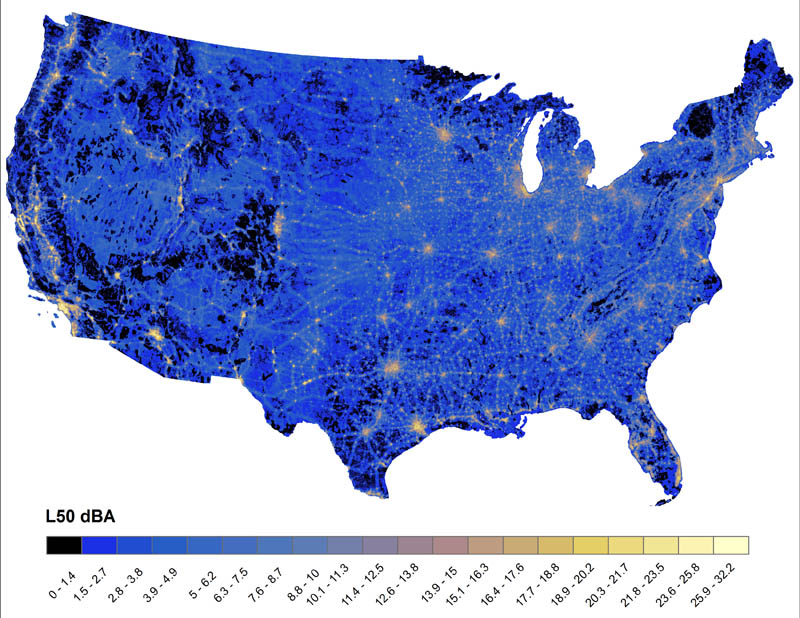
Fig. #3: The impact of anthropogenic activity across the contiguous United States (L50 sound pressure level).
For those who have lived in an urban area and visited remote or protected lands, the scaling of noise magnitude with development is of no surprise. However, the quantity of land with a relatively low level of impact is striking. Furthermore, the locations of the areas that are left suggest that ecological systems are heavily fragmented. Understanding the current extent of noise pollution across the country and the factors that will drive it in the future is a vital step towards proactive management. Monitoring remains essential to track conditions and test the effectiveness of mitigations over time. However, conventional noise impact studies have a need for spatially accurate reference conditions. By establishing a natural baseline, a critical gap has been filled that allows for understanding field data and estimating a proxy when such measurements are not possible.