Mark Houben (1) -
M.M.J.Houben@tue.nl
Luuk Franssen (1), Armin Kohlrausch (1,2), Dik Hermes (1), Berry Eggen (1,2)
(1) IPO, Center for Research on User-System Interaction
P.O. Box 513, NL 5600 MB Eindhoven, The Netherlands
(2) Philips Research Laboratories Eindhoven
Prof. Holstlaan 4, 5656 AA Eindhoven, The Netherlands
Popular version of paper 1pSP6
Presented Monday afternoon, March 15, 1999
ASA/EAA/DAGA '99 Meeting, Berlin, Germany
We are investigating the perception of recorded sounds of rolling wooden balls. We are interested in this type of sound, because the rolling ball can be used as a metaphor for cursor movement obtained by movement of a mouse or trackball. Implementation of auditory information that is consistent with visual feedback might have the potential to increase the ease-of-use and direct involvement of users.
We performed two experiments. In the first one we studied whether subjects can detect differences in the size of rolling balls. In the second experiment the perception of the velocity of rolling balls was examined. If subjects are able to correctly associate the recorded sounds with the size or velocity of the rolling ball, the results can be used to search for perceptually relevant acoustic structures produced by the rolling ball, i.e. to find a relation between psycho-acoustical and physical dimensions. In a later stage we intend to synthesize parameterized sounds of rolling balls whereby information to be displayed can be mapped to dimensions of the rolling ball, such as velocity and size.
 Click the icon to hear a sound example (216 kB, wave format).
You will hear the sound of a rolling ball followed by another sound of a rolling ball with different size. Can you tell which one of the two sounds is generated by the bigger ball?
Eight subjects participated in the experiment. Figure 1 represents the means and standard deviations of the individual percentage correct responses Pc for the various stimulus pairs.
|
|
Figure 1: Results of size experiment. Percentage correct responses (Pc) is represented as a function of the stimulus pair. The blue horizontal dot-dashed line is the upper boundary of the 95% confidence interval for guessing. Mean data are shown by circles, standard deviations by vertical bars. The number pairs on the x-axis denote the two diameters of the rolling ball in the stimulus pair. |
Figure 1 shows that subjects are able to discriminate between the sounds of rolling balls with different sizes. Only for the stimulus pair comprising diameters 22 mm and 25 mm Pc is not significantly above chance. All subjects performed near chance for this stimulus pair which implies that labelling was not the problem - subjects did not mistake the smallest ball for the largest one. The relative difference in size between the two balls in this particular stimulus pair is the smallest of all stimulus pairs and probably too small to be perceived by the subjects. All subjects indicated that they attended to the frequency or timbre of the sound. Low frequencies or dark timbres were apparently associated with large balls.
 Click the icon to hear a sound example (216 kB, wave format).
You will hear the sound of a rolling ball followed by another sound of a rolling ball with different rolling speed. Can you tell which one of the two sounds is generated by the fastest ball?
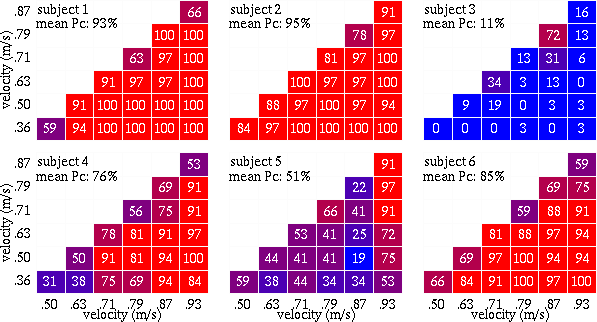
Six subjects participated in this study. Every pair was presented 32 times. The results per subject are visualized in Figure 2. The colored squares denote stimulus pairs. The percentage correct responses (Pc) of 32 presentations of the concerned stimulus pair are printed within these blocks and are indicated by the color of the square (from red = 100% to blue = 0% correct).

Figure 2: Results of velocity experiment. Percentage correct responses are depicted per subject and per stimulus combination. In the top-left corner of the panels the mean percentage correct responses are given.
With one exception (subject 5), the subjects can clearly discriminate between rolling balls with different velocities. A clear trend can be observed that errors occur primarily for stimulus pairs close to the diagonal, implying a small difference between the velocities in a pair. One subject (subject 3) had much difficulties in labelling the sounds correctly. This subject consistently mistook the slowest rolling ball in each pair for the fastest rolling ball. Obviously, most subjects are able to discriminate between rolling balls with different velocities, but due to the lack of feedback, some subjects have difficulties with labelling.
Because of the labelling difficulty exhibited by some subjects, one should be careful to use the sound of rolling balls with different velocities as a stand-alone signal instead of integrating it with other types of feedback. One might expect that in a multimodal application in which abundant cues are available, the labelling problem is easily resolved.
Answers to the sound examples.
In the first example (size experiment), the first ball has a diameter of 35 mm, the second one 45 mm (both with a velocity of 0.75 m/s). So the second sound is the one made by the largest ball.
In the second example (velocity experiment), the first ball has a velocity of 0.87 m/s, the second one 0.71 m/s (in both cases the diameter is 45 mm). So the first sound is the one made by the fastest rolling ball.