151st ASA Meeting, Providence, RI
Using Sound to Measure and Predict the Ocean Weather
Peter J. Stein- pstein@sciol.com
Subramaniaum D. Rajan- srajan@sciol.com
Scinetific Solutions, Inc.
99 Perimeter Road
Nashua, NH 03049
James K. Lewis- ocnphys@aloha.net
Scientific Solutions, Inc.
4875 Kikala Road
Kalaheo, Hawaii 96741
Popular version of paper 4aUW3
Presented Thursday morning, June 8, 2006
151st ASA Meeting, Providence, RI
Similar to the atmosphere, the weather of the ocean changes from day to day and hour to hour. The term ocean weather relates to the distribution of ocean currents, temperature, and salinity. Changes in currents, temperature, and salinity are a result of variations in atmospheric conditions, the phases of the tides, river outflows, waves, and large-scale ocean currents. These phenomena result in ocean weather that not only varies with time but can also vary, sometimes dramatically, over distances of kilometers. The ocean is far more dynamic and variable then one would think.
There are many reasons to monitor and predict ocean weather. There are practical applications such as commercial shipping, search and rescue, supervising fisheries, etc., as well as monitoring the conditions of an environment that man is impacting more and more every year (e.g., global warming). To attempt to monitor the ocean, an extensive sampling program could be undertaken for every location of interest. Such sampling programs (collecting data from ships, moored arrays of measurement instruments, satellite observations, etc.) can provide reasonably accurate data, but are expensive to implement and conduct. And there is almost always a practical limit to the spatial and temporal resolution that can be achieved.
As opposed to sampling programs, a useful rendition of an ocean environment can often be provided by three-dimensional, high-resolution, dynamic ocean circulation models. Such models are similar to atmospheric models used by weather services and can provide nowcasts and forecasts of ocean weather over large areas. But to improve the accuracy of such models, observed ocean characteristics should be assimilated into the models. But typically, such observations or measurements come from sampling programs with their inherent limitations.
Our research over the last four years has been addressing the problem of coupling ocean circulation modeling with a reasonable and unobtrusive means of measuring variations in the weather of the ocean. The measurement technology we have been pursuing is that of ocean tomography, the use of variations in the time it take for an acoustic signal to travel between a fixed sound source and a fixed receiver. An example of variations in travel time is shown in Fig. 1. The source and receiver are on the ocean bottom, ~3.5 km apart. The travel times in Fig. 1 are for the direct sound path from the source to the ocean surface and then back down to the receiver. There are distinct and measurable travel time variations over the 4-day period. These are mostly due to tides and daily surface heating and cooling. So, even though the source and receiver are fixed in place, the time it takes for the sound to travel across the path changes with time, a direct reflection of changes in the water column induced by tides and atmospheric forcing. As the tide flows across a region, changes in the structure of the water temperature and salinity occur. Sound speed increases as temperature and/or salinity increase, and, thus, travels time changes.
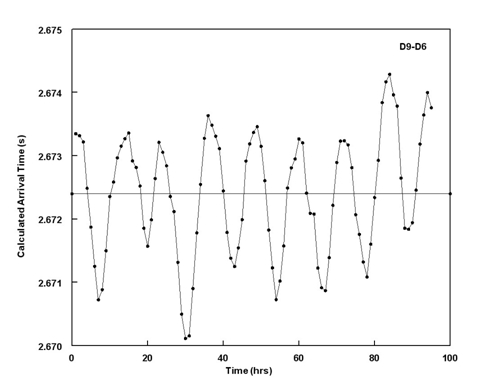
Fig. 1. Variations in the time sound takes to travel between a source and a receiver that are ~3.5 km apart.
Ocean tomography is not new, having been studied for the last 40+ years. Our work has been aimed at developing a technology to transition ocean tomography out of the laboratory and into practical use. This technology, the Coupled Oceanographic-Tomographic Analysis and Prediction System (COTAPS), couples an ocean circulation model of a region in which travel time data from a network of high-frequency (9-13 kHz) acoustic nodes (sources and receivers) are available. We have been working with bottom-mounted nodes, an approach that limits damage to the node network from weather, fishing activities, ship traffic, and pilfering. A data assimilation technique has been developed that imposes corrections to the ocean model temperature and salinity structure based on observed arrival times. Fig. 2 shows an example of the corrections made to the temperature profiles at a location off the west coast of Kauai, Hawaii.
Features of COTAPS include a technique and associated software for assessing sound path information in the area in which the network of nodes is deployed, an automated method for calculating critical matrices used in the assimilation process, and a suggested design of the acoustic nodes.
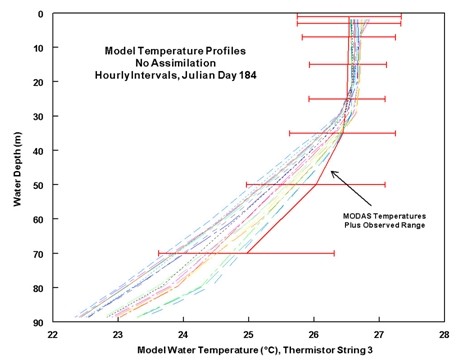 |
 |
Fig. 2. Model-predicted temperature profiles off west Kauai, Hawaii, for 3 July 2003 (left) without and (right) with assimilation of observed travel time data. The MODAS data are from the Navy's Modular Ocean Data Assimilation System for the same day and location. |
There are a number of issues that remain to be researched. These include significant variability of observed arrival times over short time intervals (< 5 min) and how to mitigate the impact of such variability, the use of observed arrival times to account for errors in the locations of the nodes in a network, and the effect of assimilating arrival time information from multiple source-receiver pairs.
[ Lay Language Paper Index | Press Room ]
|