Roger Waxler - rwax@olemiss.edu
with Kenneth Gilbert and Carrick Talmadge
The National Center for Physical Acoustics at the University of Mississippi
University, MS 38677
Popular version of paper 5aNS5
Presented Saturday morning, Dec 2, 2006
4th ASA/ASJ Joint Meeting, Honolulu, HI
Sound propagation outdoors is strongly influenced by meteorological conditions. In fair weather, under clear skies, the greatest distinction is between day and night. The air itself is not nearly as efficient as the ground in absorbing or radiating heat so that the heating of the earth we feel during the day and the cooling we experience at night is mediated through the ground. During the day the ground is heated by the sun while the air is heated by contact with the ground. At night the reverse occurs: the ground cools by radiating heat to outer space while the air is cooled by the ground. During the day the temperature of the air is highest at the ground and decreases with increasing altitude. During the night, however, one generally finds a temperature inversion: the temperature increases with increasing altitude to a maximum at a height (typically between 100 and 300 meters elevation) determined by time of night and local conditions. Above this the temperature begins to decrease.
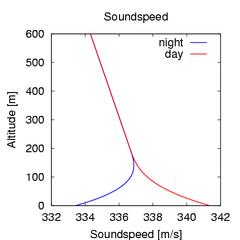
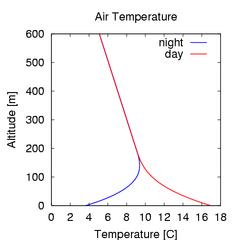 The significance of the temperature of the air is that it determines
the speed with which sound propagates. Sound travels faster in warmer air
and slower in colder air. On clear days sound travels faster in the warmer
air near the ground than it does in the cooler air above. This causes
wave fronts to refract upwards towards the colder air and away from
the ground. On clear nights, however, sound produced near the ground can
get trapped between the cooler ground and the warmer air above. The nocturnal
temperature inversion produces a sound channel, or duct, in the first hundred
meters or so of the atmosphere in which sound propagates efficiently to long
ranges from the source.
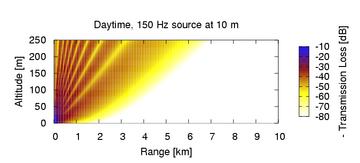
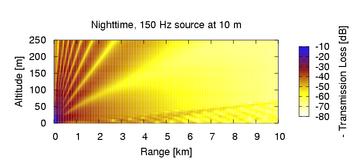
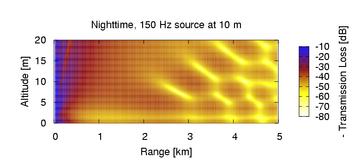
This behavior is illustrated in the figures above which depict monotone sound propagation in a model daytime environment versus a model nighttime environment. The color scale indicates by how many decibels the sound level is reduced over the level at a distance of one meter from the source. Note the complicated interference pattern that develops along the ground in the nocturnal duct at long ranges from the source.
At a fixed frequency, sound in a duct can generally be described as a superposition of independently propagating modes. In the nocturnal duct (Waxler 2002 and 2004) each mode has a characteristic vertical form mathematically analogous to the bound states of an atom. Different modes propagate horizontally with different sound speeds and attenuate at different rates. The complex patterns seen in the nocturnal duct are from constructive and destructive interference between the modes. Attenuation increases dramatically with increasing frequency, however, at a fixed frequency, differences between the attenuation rates of different modes can be significant. Generally, the more contact a mode has with the ground the greater the attenuation.
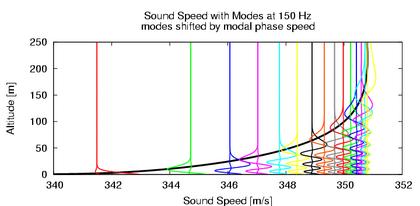
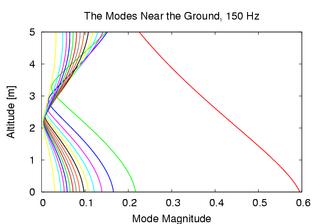
 The vertical mode shapes at 150 Hz produced by a model nocturnal sound speed
profile are shown above. The modes are shifted by their propagation
speeds and then superimposed on the sound speed profile. The magnitudes of
the modes in the lowest five meters of the atmosphere are plotted against
each other. Note that one mode stands out: it is slower than the rest and it
has much larger magnitude on the ground than the rest (and thus attenuates
much more rapidly). We call this mode the surface mode. The magnitude of the
surface mode decreases rapidly with increasing altitude, but it does so
monotonically. The other modes can extend high into the atmosphere, but all
have a deep minimum at approximately the same height. Once the surface mode
has attenuated to negligible levels the sound field is given by a
superposition of the remaining modes, all of which have an approximately
collocated minimum. Thus, the magnitude of the sound field develops a deep
minimum at a fixed height, independent of range. This "quiet height" is
visible in the figure above as a horizontal line at about 2 meters elevation
beginning about a half a kilometer from the source.
 An experiment was performed to test the theoretical prediction of a quiet
height. The experiment was performed under clear skies in the evening in
April of 2004 on a farm in Marks Mississippi in the Mississippi River Delta.
In this area the ground is very flat, there are few obstacles for sound to
reflect off of and there is little environmental noise. The location was
chosen to minimize the influence of factors other than meteorology.
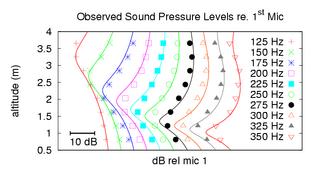 The experiment consisted of a 4
meter tower of 8 microphones placed about 1.8 kilometers from a loudspeaker.
Each experimental run consisted of twelve ten second sweeps from 100 Hz to
500 Hz. There was approximately a half of an hour between runs. All of the
runs produced similar results. The results from the run at 8:30, and their
comparison with theory, are depicted to the left. The solid lines are the
theoretical predictions and the points are the observed values. The sound
levels at each microphone, relative to the level at the lowest microphone
are plotted. Each curve represents a different frequency. The existence of
a quiet height, at which sound levels are reduced by about 10 dB from the
levels on the ground, is clearly demonstrated (Waxler et. al. 2006).
Complimenting the narrow frequency band phenomenon of the quiet height is the low frequency pulse tail. It has been observed (Chunchuzov et. al. 1990) that impulses propagating to large distances from their source develop a low frequency tail. This tail is the surface mode. The surface mode has a slower speed of propagation than the other modes and a higher rate of attenuation. Since it propagates more slowly, it forms a tail arriving at the end of the pulse. Since it has a higher attenuation rate, and since attenuation is highest at the higher frequencies, the surface mode is a low band pass filter as compared to the other modes, attenuating the higher frequencies much more rapidly.
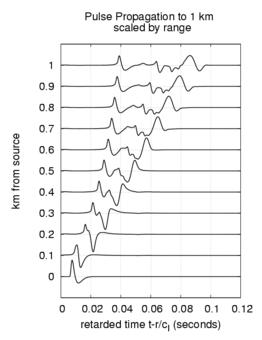
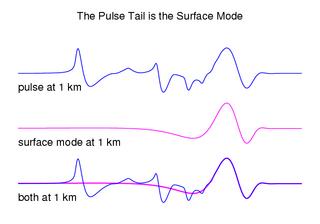 Two plots of simulated pulse propagation are shown. In the first the pulse
is tracked to a range of 1 km. The magnitudes are scaled up so that the
pulse remains visible despite it's attenuating amplitude. The second plot
shows the pulse at a range of 1 km from the source and is compared to the
pulse that would be observed if the surface mode were propagating alone.
As a pulse propagates in a duct it distorts and elongates. In the nocturnal
duct, as seen in the plots, the pulse develops a smooth tail. This tail is
clearly demonstrated to be the surface mode. The low frequency nature of the
surface mode component is visible in the smoothness of the surface mode pulse
shape. Abrupt changes require high frequencies so that as its higher frequency
components attenuate a pulse becomes smoother.
References:
Roger Waxler, "A vertical eigenfunction expansion for the propagation of sound in a downward refracting atmosphere over a complex impedance plane," J. Acoust. Soc. Am. vol. 112 no. 6, pp 2540-2552 (2002)
Roger Waxler, "Modal expansions for sound propagation in the nocturnal boundary layer," J. Acoust. Soc. Am. vol. 15 no. 4, pp 1437-1448 (2004)
P. Chunchuzov, G. A. Bush and S. N. Kulichkov, "On acoustical impulse propagation in a moving inhomogeneous atmospheric layer," J. Acoust. Soc. Am. vol. 88 no. 1, pp 455-461 (1990)
Roger Waxler, Carrick L. Talmadge, Shantharam Dravida, and Kenneth E. Gilbert, "The near-ground structure of the nocturnal sound field" J. Acoust. Soc. Am. vol. 119 no. 1, pp 86-95 (2006)