4aMU1 – Are phantom partials produced in piano strings?

Thomas Moore – tmoore@rollins.edu
Lauren Neldner – lneldner@rollins.edu
Eric Rokni – erokni@rollins.edu

Department of Physics
Rollins College
1000 Holt Ave – 2743
Winter Park, FL 32789

Popular version of paper 4aMU1, “Are phantom partials produced in piano strings?”
Presented Thursday morning, November 8, 2018, 8:55-9:10 AM, Crystal Ballroom (FE)
176th ASA Meeting, Victoria, BC

The unique sound of the piano, or any stringed musical instrument, begins with the vibrating string. The string vibrations produce many different musical pitches simultaneously, most of which are harmonics of the note being played. The final sound depends both on the relative power in each of the harmonics in the string, as well as how efficiently these sounds are transferred to the air. This type of arrangement, where there is a source of the sound (the strings) and a mechanism to transmit the sound to the air (the wooden parts of a piano) is often referred to as a source-filter system. The vibrations from the string are said to be filtered through the bridge and soundboard because these wooden components do not transmit every pitch equally efficiently. The wood can change the balance of the sound created by the string, but it cannot add new sounds.

The work reported in this presentations shows that this idea of how the piano works is flawed. Experiments have shown that the wooden parts of the piano can produce sounds that are not created in the string. That is, the wood can be a source of sound as well as the string, and it is not always simply a filter. The sound originating in the wood occurs at frequencies that are sums and differences of the frequencies found in the vibrations of the string, but they are created in the wood not the string.

These anomalous components in the sound from a piano, commonly referred to as phantom partials, were first reported in 1944,1 and work over the following 70 years resulted in the conclusion that they originate in the stretching of the string as it vibrates.2,3 Therefore, the source of all of the sound from a piano is still considered to be the string. This idea has been incorporated into the most complex computer models of the piano, which may eventually be used to study the effects of changing the piano design without having to build a new piano to determine if the change is desirable.

The commonly accepted idea that phantom partials can originate in the string is not wrong – some of the phantom is created by the string motion. However, the work reported in this presentation shows that only a small part of the power in the phantom partials comes from the string. Much more of the phantom partial is created in the wood. This has implications for those trying to build computer models of the piano, as well as those trying to understand the difference between a good piano and a truly great one.

Before this new information can be included in the latest computer models, the process that creates phantom partials in the wood must be understood. The next step is to develop a theory that can describe the process, and test the theory against further experiments. But the idea that the piano is merely a source-filter system will have to be abandoned if we are to understand this wonderful and ubiquitous musical instrument.

1)  A. F. Knoblaugh, “The clang tone of the piano forte,” J. Acoust. Soc. Am. 128, 102 (1944).

2)  H. A. Conklin, “Generation of partials due to nonlinear mixing in a stringed instrument,” J. Acoust. Soc. Am. 105, 536-545 (1999).

3)  N. Etchenique, S. R. Collin, and T. R. Moore, “Coupling of transverse and longitudinal waves in piano strings,” J. Acoust. Soc. Am. 137, 1766-1771 (2015).

3pID2 – Yanny or Laurel? Acoustic and non-acoustic cues that influence speech perception

Brian B. Monson, monson@illinois.edu

Speech and Hearing Science
University of Illinois at Urbana-Champaign
901 S Sixth St
Champaign, IL 61820
USA

Popular version of paper 3pID2, “Yanny or Laurel? Acoustic and non-acoustic cues that influence speech perception”
Presented Wednesday afternoon, November 7, 1:25-1:45pm, Crystal Ballroom FE
176th ASA Meeting, Victoria, Canada

“What do you hear?” This question that divided the masses earlier this year highlights the complex nature of speech perception, and, more generally, each individual’s perception of the world.  From the yanny v. laurel phenomenon, it should be clear that what we perceive is dependent not only upon the physics of the world around us, but also upon our individual anatomy and individual life experiences. For speech, this means our perception can be influenced greatly by individual differences in auditory anatomy, physiology, and function, but also by factors that may at first seem unrelated to speech.

In our research, we are learning that one’s ability (or inability) to hear at extended high frequencies can have substantial influence over one’s performance in common speech perception tasks.  These findings are striking because it has long been presumed that extended high-frequency hearing is not terribly useful for speech perception.

Extended high-frequency hearing is defined as the ability to hear at frequencies beyond 8,000 Hz.  These are the highest audible frequencies for humans, are not typically assessed during standard hearing exams, and are believed to be of little consequence when it comes to speech.  Notably, sensitivity to these frequencies is the first thing to go in most forms of hearing loss, and age-related extended high-frequency hearing loss begins early in life for nearly everyone.  (This is why the infamous “mosquito tone” ringtones are audible to most teenagers but inaudible to most adults.)

Previous research from our lab and others has revealed that a surprising amount of speech information resides in the highest audible frequency range for humans, including information about the location of a speech source, the consonants and vowels being spoken, and the sex of the talker. Most recently, we ran two experiments assessing what happens when we simulate extended high-frequency hearing loss.  We found that one’s ability to detect the head orientation of talker is diminished without extended high frequencies.  Why might that be important?  Knowing a talker’s head orientation (i.e., “Is this person facing me or facing away from me?”) helps to answer the question of whether a spoken message is intended for you or someone else.  Relatedly, and most surprisingly, we found that restricting access to the extended high frequencies diminishes one’s ability to overcome the “cocktail party” problem.  That is, extended high-frequency hearing improves one’s ability to “tune in” to a specific talker of interest when many interfering talkers are talking simultaneously, as when attending a cocktail party or other noisy gathering.  Do you seem to have a harder time understanding speech at a cocktail party than you used to?  Are you middle-aged?  It may be that the typical age-related hearing loss at extended high frequencies is contributing to this problem.  Our hope is that assessment of hearing at extended high frequencies will become standard routine for audiological exams.  This would allow us to determine the severity of extended high-frequency hearing loss in the population and whether some techniques (e.g., hearing aids) could be used to address it.

Yanny or Laurel

Figure 1. Spectrographic representation of the phrase “Oh, say, can you see by the dawn’s early light.” While the majority of energy in speech lies below about 6,000 Hz (dotted line), extended high-frequency (EHF) energy beyond 8,000 Hz is audible and assists with speech detection and comprehension.

2pAB8 – Blind as a bat? Evidence suggests bats use vision to supplement echolocation in presence of ambient light

Kathryn A. McGowan – kmcgowan01@saintmarys.edu
Saint Mary’s College
Le Mans Hall, 149
Notre Dame, IN 46556

Presented Tuesday afternoon, November 6, 2018
176th ASA Meeting, Victoria, British Columbia

Bats use echolocation, or biological sonar, to make an auditory picture of their environment when foraging and avoiding obstacles in flight (1). To echolocate, bats emit a loud, high-pitched sound using their mouth or nose. The sound bounces off an object and returns to the bat as an echo, providing each individual with information about the object characteristics and location. While echolocation allows for the detection and discrimination of targets, the high-pitched frequency sounds that bats emit when echolocating provide a limited range of information (2). Despite being known for flying at night, some bats spend only a part of their time flying in complete darkness, suggesting that they may also rely on vision to supplement their echolocation in environments that have more light (2, 3). Previous studies have demonstrated that vision in bats influences flight behavior, which suggests bats may combine vision and echolocation to sense their environment (2). It is, therefore, accepted that bats are not blind, as the common phrase suggests, but little is known about how vision influences the way bats use echolocation.

Figure 1. Swarm of Brazilian free-tailed bats flying during daylight hours after emergence. Photo Credit – Dr. Laura Kloepper, 2018

The Brazilian free-tailed bat migrates annually from Mexico to form large maternal colonies in caves in the Southwestern United States (2). These bats forage for insects in flight and emerge from the cave in groups of thousands for nightly foraging. The bats return to the cave in the early hours of the morning, requiring them to navigate back to their complex cave environment across a vast, open landscape. This reentry occurs across periods of complete darkness as well as early morning hours when ambient light is present. This suggests that bats have the option of using both echolocation and visual cues to navigate their environment in hours of daylight. Our research addresses how bats change their echolocation calls from an open environment to the more complex cave edge environment, and how the presence of daylight may influence their level of echolocation when accomplishing this feat.

bat echolocation

Figure 2. Spectrogram image of a sequence of bat echolocation calls recorded at the cave environment.

Compared to the calls used over a vast landscape, bats at the cave edge used more complex calls that gathered more precise information about that environment. During hours of daylight, however, these calls collected less precise information than hours of darkness. As less information was gathered acoustically by bats during daylight hours, it is likely that bats are getting information from visual cues once daybreak occurs. This supplementing of vision for echolocation indicates that despite what the phrases say, bats are not blind.

Video 1. Bats emerging for foraging during early dusk.

  1. Moss, C. F., & Surlykke, A. 2010. Probing the natural scene by echolocation in bats. Frontiers in Behavioral Neuroscience 4: 33.
  2. Mistry, S. 1990. Characteristics of the visually guided escape response of the Mexican free-tailed bat Tadarida Brasiliensis Animal Behavior 39: 314-320.
  3. Davis, W.H., Barbour, R.W. 1965. The use of vision in flight by the bat Myotis sodalis. The American Midland Naturalist 74: 497–499.

2aBAa3 – Towards a better understanding of myopia with high-frequency ultrasound

Jonathan Mamou – jmamou@riversideresearch.org
Daniel Rohrbach
Lizzi Center for Biomedical Engineering, Riverside Research, New York, NY, USA

Sally A. McFadden – sally.mcfadden@newcastle.edu.au
Vision Sciences, Hunter Medical Research Institute and School of Psychology, Faculty of Science, University of Newcastle, NSW, Australia

Quan V. Hoang – donny.hoang@snec.com.sg
Department of Ophthalmology, Columbia University Medical Center, New York, NY USA
Singapore Eye Research Institute, Singapore National Eye Centre, DUKE-NUS, Singapore

Myopia, or near-sightedness, affects up to 2.3 billion people and has a high prevalence. Although minimal levels of myopia are considered a minor inconvenience, high myopia is associated with sight-threatening pathology in 70% of patients and is highly prevalent in East Asians. By 2050, an estimated one billion people will have high myopia. High-myopia patients are prone to developing “pathologic myopia”, in which a high likelihood of permanent vision loss exists. Myopia is caused by an excessive eye length for the focusing power of the eye. Pathologic myopia occurs at extreme levels of lifelong, progressive eye elongation and subsequent thinning of the eye wall (sclera) and development of localized outpouchings (staphyloma). A breakdown in the structural integrity of the eye wall likely underlies myopic progression and precedes irreversible vision loss.

The guinea pig is a well-established animal model of myopia. With imposed blurring of the animals vision early in life, guinea pigs experience excessive eye elongation and develop high myopia within a week, which leads to pathologic myopia within 6 weeks. Therefore, we investigated two, fine-resolution ultrasound-based approaches to better understand and quantify the microstructural changes occurring in the posterior sclera associated with high-myopia development. The first approach termed quantitative-ultrasound (QUS) was applied to intact ex-vivo eyeballs of myopic and control guinea-pig eyes using an 80-MHz ultrasound transducer (Figure 1).

myopia

QUS yields parameters associated with the microstructure of tissue and therefore is hypothesized to provide contrast between control and myopic tissues. The second approach used a scanning-acoustic-microscopy (SAM) system operating at 250 MHz to form two-dimensional maps of acoustic properties of thin sections of the sclera with 7-μm resolution (Figure 2).

myopia

Like QUS, SAM maps provide striking contrast in the mechanical properties of control and myopic tissues at fine resolution. Initial results indicated that QUS- and SAM-sensed properties are altered in myopia and that QUS and SAM can provide new contrast mechanisms to quantify the progression and severity of the disease as well as to determine what regions of the sclera are most affected. Ultimately, these methods will provide novel knowledge about the microstructure of the myopic sclera that can improve monitoring and managing high myopia patients.

5aSC1 – Understanding how we speak using computational models of the vocal tract

Connor Mayer – connomayer@ucla.edu
Department of Linguistics – University of California, Los Angeles

Ian Stavness – ian.stavness@usask.ca
Department of Computer Science – University of Saskatchewan

Bryan Gick – gick@mail.ubc.ca
Department of Linguistics – University of British Columbia; Haskins Labs

Popular version of poster 5aSC1, “A biomechanical model for infant speech and aerodigestive movements”
Presented Friday morning, November 9, 2018, 8:30-11:30 AM, Upper Pavilion
176th ASA Meeting and 2018 Acoustics Week in Canada, Victoria, Canada

Speaking is arguably the most complex voluntary movement behaviour in the natural world. Speech is also uniquely human, making it an extremely recent innovation in evolutionary history. How did our species develop such a complex and precise system of movements in so little time? And how can human infants learn to speak long before they can tie their shoes, and with no formal training?

Answering these questions requires a deep understanding of how the human body makes speech sounds. Researchers have used a variety of techniques to understand the movements we make with our vocal tracts while we speak – acoustic analysis, ultrasound, brain imaging, and so on. While these approaches have increased our understanding of speech movements, they are limited. For example, the anatomy of the vocal tract is quite complex, and tools that measure muscle activation, such as EMG, are too invasive or imprecise to be used effectively for speech movements.

Computational modeling has become an increasingly promising method for understanding speech. The biomechanical modeling platform Artisynth (https://www.artisynth.org), for example, allows scientists to study realistic 3D models of the vocal tract that are built using anatomical and physiological data.

These models can be used to see aspects of speech that are hard to visualize using other tools. For example, we can see what shape the tongue takes when a specific set of muscles activates. Or we can have the model perform a certain action and measure aspects of the outcome, like having the model produce the syllable “ba” and looking at how much the lips deform by mutual compression during their contact in the /b/ sound. We can also predict how changes to typical vocal tract anatomy, such as the removal of part of the tongue in response to oral cancer, affect the ability to perform speech movements.

In our project at the 176th ASA Meeting, we present a model of the vocal tract of an 11 month old infant. A detailed model of the adult vocal tract named ‘Frank’ has already been implemented in Artisynth, but the infant vocal tract has different proportions than an adult vocal tract. Using Frank as a starting point, we modified the relative scale of the different structures based on measurements taken from CT scan images of an infant vocal tract (see Figure 1).

Going forward, we plan to use this infant vocal tract model (see Figure 2) to simulate both aerodigestive movements and speech movements. One of the hypotheses for how infants learn to speak so quickly is that they build on movements they can carry out at birth, such as swallowing or suckling. The results of these simulations will help supplement neurological, clinical, and kinematic evidence bearing on this hypothesis. In addition, the model will be generally useful for researchers interested in the infant vocal tract. 

vocal tract
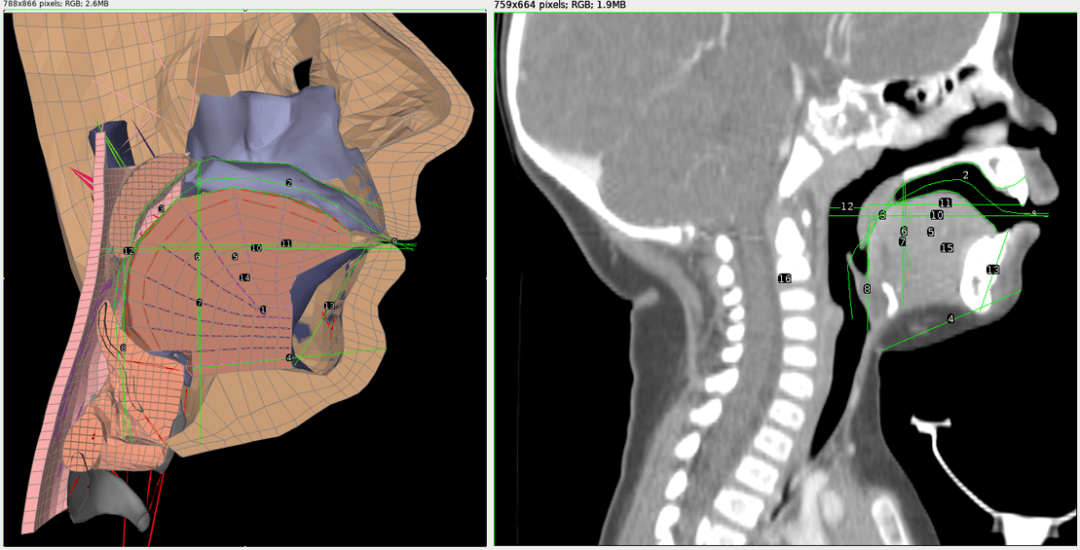
Figure 1: Left: A cross-section of the Frank model of an adult vocal tract with measurement lines. Right: A cross-sectional CT scan image of an 11 month old infant with measurement lines. The relative proportions of each vocal tract were compared to generate the infant model.

 Figure 2: A modified Frank vocal tract conforming to infant proportions.