2aID11 – A transducer not to be ignored: The siren

J. D. Maynard
Department of Physics
The Pennsylvania State University
University Park, PA 16802

Popular version of paper 2aID11
Presented Tuesday morning, October 28, 2014
168th ASA Meeting, Indianapolis

The siren is a source of sound (or sound transducer) which captures our attention because we know it may emanate from a police vehicle, fire engine, tornado warning tower or other danger warning system. However, there is another reason to heed the siren: it can be a “death ray”! Most of us know of the death ray from science fiction stories which describe a device which can annihilate whole armies silently from a distance. Around 1950 there were newspaper stories which heralded the advent of an actual death ray, with headlines and text such as: “‘Death Ray’ May Be Red [Soviet] Weapon. In the great super arms duel between east and west, has Russia successfully added the “death ray” to its growing arsenal?” (Franklin Johnson, OP, Washington, February 17, 1953) and “US sound ray kills mice in minute. The United States Army has announced the development of a supersonic death ray that kills mice in one minute. In spite of precautions the ray has inflicted burns, dizzyness and loss of balance on laboratory workers.” (American journal, New York, 1947). It may be assumed, and in some cases known, that the death ray referred to in these articles was a high intensity siren which was “silent” because it operated at a frequency above the threshold of human hearing (humans cannot hear frequencies above about 20,000 cycles per second). It was “high intensity” because it operated at a power level which was 10,000 times louder than the level of sound where the sense of “loudness” disappears and pain sets in; at the much louder level, pain becomes death, at least for mice.

A likely cause for the news articles was research with a siren undertaken by acousticians C. H. Allen and Isadore Rudnick, working under H. K. Schilling, Director of the Pennsylvania State College Acoustics Laboratory in 1946. Anyone who knew Izzy Rudnick would hypothesize that his response to the news articles would have been “Rumors of my death ray have been greatly exaggerated”. Indeed, a mouse had to be within about four inches (about 10 centimeters) of the siren in order to be killed, and its death was deemed to be a result of an increase in the temperature of the mouse due to absorption of the sound. In the same manner, the siren was used to heat a cup of coffee, ignite a ball of cotton and pop popcorn. The figure below shows the “trumpet horn” shaped opening of a siren, above which a glass tube is suspended; the lower part of the glass tube contains some popcorn kernels, and the upper part shows some popcorn popping upward.

At close range, a high intensity siren could cause human inner ear problems and deafness, and could set your hair on fire, but it could never be a real death ray. For the most part, the siren has received serious study by acousticians so as to make it a more efficient and longer range danger warning device.

[MISSING IMAGE] Figure. A high intensity acoustic siren being used to pop popcorn.

3aPA8 – Using arrays of air-filled resonators to reduce underwater man-made noise

Kevin M. Lee – klee@arlut.utexas.edu
Andrew R. McNeese – mcneese@arlut.utexas.edu
Applied Research Laboratories
The University of Texas at Austin

Preston S. Wilson – wilsonps@austin.utexas.edu
Mechanical Engineering Department and Applied Research Laboratories
The University of Texas at Austin

Mark S. Wochner – mark@adbmtech.com
AdBm Technologies

Popular version of paper 3aPA8
Presented Wednesday Morning, October 29, 2014
168th Meeting of the Acoustical Society of America, Indianapolis, Indiana
See also: Using arrays of air-filled resonators to attenuate low frequency underwater sound in POMA

Many marine and aquatic human activities generate underwater noise and can have potentially adverse effects on the underwater acoustical environment. For instance, loud sounds can affect the migratory or other behavioral patterns of marine mammals [1] and fish [2]. Additionally, if the noise is loud enough, it could potentially have physically damaging effects on these animals as well.

Examples of human activities that that can generate such noise are offshore wind farm installation and operation; bridge and dock construction near rivers, lakes, or ports; offshore seismic surveying for oil and gas exploration, as well as oil and gas production; and noise in busy commercial shipping lanes near environmentally sensitive areas, among others. All of these activities can generate noise over a broad range of frequencies, but the loudest components of the noise are typically at low frequencies, between 10 Hz and about 1000 Hz, and these frequencies overlap with the hearing ranges of many aquatic life forms. We seek to reduce the level of sound radiated by these noise sources to minimize their impact on the underwater environment where needed.

A traditional noise control approach is to place some type of barrier around the noise source. To be effective at low frequencies, the barrier would have to be significantly larger than the noise source itself and more dense than the water, making it impractical in most cases. In underwater noise abatement, curtains of small freely rising bubbles are often used in an attempt to reduce the noise; however, these bubbles are often ineffective at the low frequencies at which the loudest components of the noise occur. We developed a new type of underwater air-filled acoustic resonator that is very effective at attenuating underwater noise at low frequencies. The resonators consist of underwater inverted air-filled cavities with combinations of rigid and elastic wall members. They are intended to be fastened to a framework to form a stationary array surrounding an underwater noise source, such as the ones previously mentioned, or to protect a receiving area from outside noise.

The key idea behind our approach is that our air-filled resonator in water behaves like a mass on a spring, and hence it vibrates in response to an excitation. A good example of this occurring in the real world is when you blow over the top of an empty bottle and it makes a tone. The specific tone it makes is related to three things: the volume of the bottle, the length of its neck, and the size of the opening. In this case, a passing acoustic wave excites the resonator into a volumetric oscillation. The air inside the resonator acts as a spring and the water the air displaces when it is resonating acts as a mass. Like a mass on a spring, a resonator in water has a resonance frequency of oscillation, which is inversely proportional to its size and proportional to its depth in the water. At its resonance frequency, energy is removed from the passing sound wave and converted into heat through compression of the air inside the resonator, causing attenuation of the acoustic wave. A portion of the acoustic energy incident upon an array of resonators is also reflected back toward the sound source, which reduces the level of the acoustic wave that continues past the resonator array. The resonators are designed to reduce noise at a predetermined range of frequencies that is coincident with the loudest noise generated by any specific noise source.

air-filled resonators

Underwater photograph of a panel array of air-filled resonators attached to a framework. The individual resonators are about 8 cm across, 15 cm tall, and open on the bottom. The entire framework is about 250 cm wide and about 800 cm tall.

We investigated the acoustic properties of the resonators in a set of laboratory and field experiments. Lab measurements were made to determine the properties of individual resonators, such as their resonance frequencies and their effectiveness in damping out sound. These lab measurements were used to iterate the design of the resonators so they would have optimal acoustic performance at the desired noise frequencies. Initially, we targeted a resonance frequency of 100 Hz—the loudest components of the noise from activities like marine pile driving for offshore wind farm construction are between 100 Hz and 300 Hz. We then constructed a large number of resonators so we could make arrays like the panel shown in the photograph. Three or four such panels could be used to surround a noise source like an offshore wind turbine foundation or to protect an ecologically sensitive area.

The noise reduction efficacy of various resonator arrays were tested in a number of locations, including a large water tank at the University of Texas at Austin and an open water test facility also operated by the University of Texas in Lake Travis, a fresh water lake near Austin, TX. Results from the Lake Travis tests are shown in the graph of sound reduction versus frequency. We used two types of resonator—fully enclosed ones called encapsulated bubbles and open-ended ones (like the ones shown in the photograph). The number or total volume of resonators used in the array was also varied. Here, we express the resonator air volume as a percentage relative to the total volume of the array framework. Notice, our percentages are very small so we don’t need to use much air. For a fixed percentage of volume, the open-ended resonators provide up to 20 dB more noise reduction than the fully encapsulated resonators. The reader should note that noise reduction of 10 dB means the noise levels were reduced by a factor of three. A 30 dB reduction is equivalent to the noise be quieted by a factor of about 32. Because of the improved noise reduction performance of the open-ended resonators, we are currently testing this type of resonator at offshore wind farm installations in the North Sea, where government regulations require some type of noise abatement to be used to protect the underwater acoustic environment.

sound_reduction

Sound level reduction results from an open water experiment in a fresh water lake.

Various types of air-filled resonators were tested including fully encapsulated resonator and open-ended resonators like the ones shown in the photograph. Because a much total volume (expressed as a percentage here) is needed, the open-ended resonators are much more efficient at reducing underwater noise.

References:

[1] W. John Richardson, Charles R. Greene, Jr., Charles I. Malme, and Denis H. Thomson, Marine Mammals and Noise (Academic Press, San Diego, 1998).

[2] Arthur Popper and Anthony Hawkins (eds.), The Effects of Noise on Aquatic Life, Advances in Experimental Medicine and Biology, vol. 730, (Springer, 2012).

4pBA1 – Ultrasound Helps Detect Cancer Biomarkers

Tatiana Khokhlova – tdk7@uw.edu
George Schade – schade@uw.edu
Yak-Nam Wang – ynwang@uw.edu
Joo Ha Hwang – jooha@uw.edu
University of Washington
1013 NE 40th St
Seattle, WA 98105

John Chevillet – jchevill@systemsbiology.org
Institute for Systems Biology
401 Terry Ave N
Seattle, WA 98109

Maria Giraldez – mgiralde@med.umich.edu
Muneesh Tewari – mtewari@med.umich.edu
University of Michigan
109 Zina Pitcher Place 4029
Ann Arbor, MI 48109

Popular version of paper 4pBA1 High intensity focused ultrasound-induced bubbles stimulate the release of nucleic acid cancer biomarkers
Presented Thursday afternoon, October 30, 2014, at 1:30 pm
168th ASA Meeting, Indianapolis

The clinical evaluation of solid tumors typically includes needle biopsies, which can provide diagnostic (benign vs. cancer) and molecular information (targetable mutations, drug resistance, etc). This procedure has several diagnostic limitations, most notably, the potential to miss the mutations only millimeters away. In response to these limitations, the concept of “liquid biopsy” has emerged in recent years: the detection of nucleic acid cancer biomarkers, such as tumor-derived microRNAs (miRNAs) and circulating tumor DNA (ctDNA). These biomarkers have shown high diagnostic value and could guide the selection of appropriate targeted therapies. However, the abundance of these biomarker classes in the circulation is often too low to be detectable even with the most sensitive techniques because of their low levels of release from the tumor.

illustration1 - Cancer Biomarkers

Figure caption: Experimental setup and the basic concept of “ultrasound-aided liquid biopsy”. Pulsed high intensity focused ultrasound (HIFU) waves create, grow and collapse bubbles in tissue, which leads to puncturing of cell membranes and capillary walls. Cancer-derived microRNAs are thus released from the cells into the circulation and can be detected in a blood sample.

How can we make tumor cells release these biomarkers into the blood? The most straightforward way would be to puncture the cell membrane so that its content is released. One technology that allows for just that is high intensity focused ultrasound (HIFU). HIFU uses powerful, controlled ultrasound waves that are focused inside human body to ablate the targeted tissue at the focus without affecting the surrounding organs. Alternatively, if HIFU waves are sent in short, infrequent but powerful bursts, they cause mechanical disruption of tissue at the focus without any thermal effects. The disruption is achieved by small gas bubbles in tissue that appear, grow and collapse in response to the ultrasound wave– a phenomenon known as cavitation. Depending on the pulsing protocol employed, the outcome can range from small holes in cell membranes and capillaries to complete liquefaction of a small region of tumor. Using this technology, we seek to release biomarkers from tumor cells into the circulation in the effort to detect them using a blood test and avoiding biopsy.

To test this approach, we applied pulsed HIFU exposures to prostate cancer tumors implanted under the skin of laboratory rats, as illustrated in the image above. For image guidance and targeting we used conventional ultrasound imaging. Blood samples were collected immediately before and at periodic intervals after HIFU treatment and were tested for the presence of microRNAs that are associated with rat prostate cancer. The levels of these miRNAs were elevated up to 12-fold within minutes after the ultrasound procedure, and then declined over the course of several hours. The effects on tissue were evaluated in the resected tumors, and we found only micron-sized areas of hemorrhage scattered through otherwise intact tissue, suggesting damage to small capillaries. These data provided the proof of principle for the approach that we termed “ultrasound-aided liquid biopsy”. We are now working on identifying other classes of clinically valuable biomarkers, most notably tumor-derived DNA, that could be amplified using this methodology.

4aSCb8 – How do kids communicate in challenging conditions?

Valerie Hazan – v.hazan@ucl.ac.uk
University College London (UCL)
Speech Hearing and Phonetic Sciences
Gower Street, London WC1E 6BT, UK

Michèle Pettinato – Michele.Pettinato@uantwerpen.be
University College London (UCL)
Speech Hearing and Phonetic Sciences
Gower Street, London WC1E 6BT, UK

Outi Tuomainen – o.tuomainen@ucl.ac.uk
University College London (UCL)
Speech Hearing and Phonetic Sciences
Gower Street, London WC1E 6BT, UK

Sonia Granlund – s.granlund@ucl.ac.uk
University College London (UCL)
Speech Hearing and Phonetic Sciences
Gower Street, London WC1E 6BT, UK

Popular version of 4aSCb8 – Acoustic-phonetic characteristics of older children’s spontaneous speech in interactions in conversational and clear speaking styles
Presented Thursday morning, October 30, 2014
168th ASA Meeting, Indianapolis

Kids learn to speak fluently at a young age and we expect young teenagers to communicate as effectively as adults. However, researchers are increasingly realizing that certain aspects of speech communication have a slower developmental path. For example, as adults, we are very skilled at adapting the way that we speak according to the needs of the communication. When we are speaking a predictable message in good listening conditions, we do not need to make an effort to pronounce speech clearly and we can expend less effort. However, in poor listening conditions or when transmitting new information, we increase the effort that we make to enunciate speech clearly in order to be more easily understood.

In our project, we investigated whether 9 to 14 year olds (divided into three age bands) were able to make such skilled adaptations when speaking in challenging conditions. We recorded 96 pairs of friends of the same age and gender while they carried out a simple picture-based ‘spot the difference’ game (See Figure 1).
Hazan1_fig
Figure 1: one of the picture pairs in the DiapixUK ‘spot the difference’ task.

The two friends were seated in different rooms and spoke to each other via headphones; they had to try to find 12 differences between their two pictures without seeing each other or the other picture. In the ‘easy communication’ condition, both friends could hear each other normally, while in the ‘difficult communication’ condition, we made it difficult for one of the friends (‘Speaker B’) to hear the other by heavily distorting the speech of ‘Speaker A’ using a vocoder (See Figure 2 and sound demos 1 and 2). Both kids had received some training at understanding this type of distorted speech. We investigated what adaptations Speaker A, who was hearing normally, made to his or her speech in order to make themselves understood by their friend with ‘impaired’ hearing, so that they could complete the task successfully.
Hazan2_fig
Figure 2: The recording set up for the ‘easy communication’ (NB) and ‘difficult communication’ (VOC) conditions.

Sound 1: Here, you will hear an excerpt from the diapix task between two 10 year olds in the ‘difficult communication’ conversation from the viewpoint of the talker hearing normally. Hear how she attempts to clarify her speech when her friend has difficulty understanding her.

Sound 2: Here, you will hear the same excerpt but from the viewpoint of the talker hearing the heavily degraded (vocoded) speech. Even though you will find this speech very difficult to understand, even 10 year olds get better at perceiving it after a bit of training. However, they are still having difficulty understanding what is being said, which forces their friend to make greater effort to communicate.

We looked at the time it took to find the differences between the pictures as a measure of communication efficiency. We also carried out analyses of the acoustic aspects of the speech to see how these varied when communication was easy or difficult.

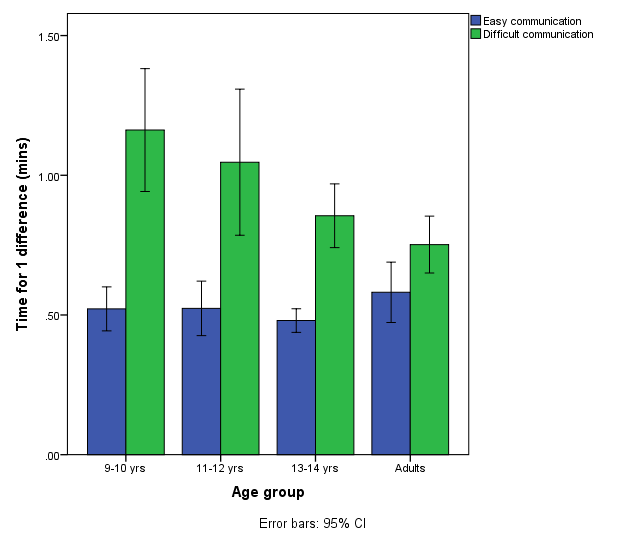
We found that when communication was easy, the child groups did not differ from adults in the average time that it took to find a difference in the picture, showing that 9 to 14 year olds were communicating as efficiently as adults. When the speech of Speaker A was heavily distorted, all groups took longer to do the task, but only the 9-10 year old group took significantly longer than adults (See Figure 3). The additional problems experienced by younger kids are likely to be due both to greater difficulty for Speaker B in understanding degraded speech and to Speaker A being less skilled at compensating for this difficulties. The results obtained for children aged 11 and older suggest that they were using good strategies to compensate for the difficulties imposed on the communication (See Figure 3).
Hazan3_fig
Figure 3: Average time taken to find one difference in the picture task. The four talker groups do not differ when communication is easy (blue bars); in the ‘difficult communication’ condition (green bars), the 9-10 years olds take significantly longer than the adults but the other child groups do not.

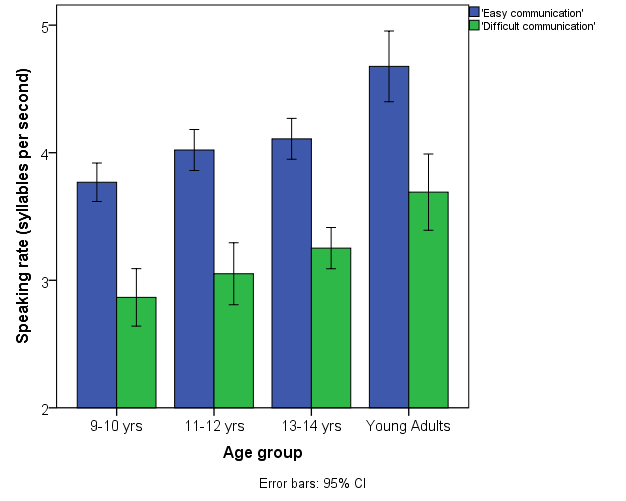
In terms of the acoustic characteristics of their speech, the 9 to 14 year olds differed in certain aspects from adults in the ‘easy communication’ condition. All child groups produced more distinct vowels and used a higher pitch than adults; kids younger than 11-12 also spoke more slowly and more loudly than adults. They hadn’t learnt to ‘reduce’ their speaking effort in the way that adults would do when communication was easy. When communication was made difficult, the 9 to 14 year olds were able to make adaptations to their speech for the benefit of their friend hearing the distorted speech, even though they themselves were having no hearing difficulties. For example, they spoke more slowly (See Figure 4) and more loudly. However, some of these adaptations differed from those produced by adults.
Hazan4_fig
Figure 4: Speaking rate changes with age and communication difficulty. 9-10 year olds spoke more slowly than adults in the ‘easy communication’ condition (blue bars). All speaker groups slowed down their speech as a strategy to help their friend understand them in the ‘difficult communication’ (vocoder) condition (green bars).

Overall, therefore, even in the second decade of life, there are changes taking place in the conversational speech produced by young people. Some of these changes are due to physiological reasons such as growth of the vocal apparatus, but increasing experience with speech communication and cognitive developments occurring in this period also play a part.

Younger kids may experience greater difficulty than adults when communicating in difficult conditions and even though they can make adaptations to their speech, they may not be as skilled at compensating for these difficulties. This has implications for communication within school environments, where noise is often an issue, and for communication with peers with hearing or language impairments.

Unlocking the Mystery of the Cervix

Timothy J Hall, Helen Feltovich, Lindsey C. Carlson, Quinton W. Guerrero, Ivan M. Rosado-Mendez
University of Wisconsin, Madison, WI (tjhall@wisc.edu)
Click here to read the abstract

The cervix, which is the opening into the uterus, is a remarkable organ. It is the only structure in the entire body that has diametrically opposed functions. The normal cervix stays stiff and closed throughout most of pregnancy while the baby develops and then completely softens and opens at just the right time so the full-grown baby can be born normally, through the vagina. This process of softening and opening involves remodeling, or breaking down, of the cervix’s collagen structure together with an increase in water, or hydration, of the cervix. When the process happens too soon, babies can be born prematurely, which can cause serious lifelong disability and even death. When it happens too late, mothers may need a cesarean delivery. [1,2]

Amazingly, even after 100 years of research, nobody understands how this happens. Specifically, it is unclear how the cervix knows when to soften, or what molecular signals initiate and control this process. As a result, obstetrical providers today evaluate cervical softness in exactly the same way as they did in the 1800s: they feel the cervix with their fingers and classify it as ‘soft’, ‘medium’ or ‘firm’. And, unsurprisingly, despite significant research effort, the preterm birth rate remains unacceptably high and more than 95% of preterm births are intractable to any available therapies.

The cervix is like a cylinder with a canal in the middle that goes up into the uterus. This is where the sperm travels to fertilize the egg, which then nests in the uterus. Cervical collagen is roughly arranged in 3 layers. There is a thin layer on the inner part that where collagen is mostly aligned along the cervical canal, and similarly a thin layer that runs along the outside of the cervix. Between these layers, in the middle of the cervix is a thicker layer of collagen that is circumferential, aligned like a belt around the canal. Researchers theorize that the inner and outer layers stabilize the cervix from tearing off as it shortens and dilates for childbirth, while the middle circumferential layer is most important for the strength and stiffness of the cervix to prevent it from opening prematurely, but nobody is certain. This information is critical to understanding the process of normal, and abnormal, cervical remodeling, and that is why recently there is growing interest in developing technology that can non-invasively and thoroughly assess the collagen in the cervix and measure its softness and hydration status. The most promising approaches use regular clinical ultrasound systems that have special processing strategies to evaluate these tissue properties.

One approach to assessing tissue softness uses ultrasound pressure to induce a shear wave, which moves outward like rings in water after a stone is dropped. The speed of the shear wave provides a measurement of tissue stiffness because these waves travel slower in softer tissue. This method is used clinically in simple tissues without layers of collagen, such as the liver for staging fibrosis. Cervical tissue is very complex because of the collagen layers, but, after many years of research, we finally have adapted this method for the cervix. The first thing we did was compare shear wave speeds in hysterectomy specimens (surgically removed uterus and cervix) between two groups of women. The first group was given a medicine that softens the cervix in preparation for induction of labor, a process called “ripening”. The second group was not treated. We found that the shear wave speeds were slower in the women who had the medicine, indicating that our method could detect the cervices that had been softened with the medicine.[3] We also found that the cervix was even more complex than we’d thought, that shear wave speeds are different in different parts of the cervix. Fortunately, we learned we could easily control for that by measuring the same place on every woman’s cervix. We confirmed that our measurements were accurate by performing second harmonic generation microscopy on the cervix samples in which we measured shear wave speeds. This is a sophisticated way of looking at the tiny collagen structure of a tissue. It told us that indeed, when the collagen structure was more organized, the shear wave speeds were faster, indicating stiffer tissue, and when the collagen started breaking down, the shear wave speeds were slower, indicating softer tissue.

The next step was to see if our methods worked outside of the laboratory. So we studied pregnant women who were undergoing cervical ripening in preparation for induction of labor. We took measurements from each woman before they got the ripening medicine, and then afterwards. We found that the shear wave speeds were slower after the cervix had been ripened, indicating the tissue had softened.[4] This told us that we could obtain useful information about the cervix in pregnant women.

We also evaluated attenuation, which is loss of ultrasound signal as the wave propagates, because attenuation should increase as tissue hydration increases. This is a very complicated measurement, but we found that if we carefully control the angle of the ultrasound beams relative to the underlying cervical structure, attenuation estimates are sensitive to the difference between ripened and unripened tissue in hysterectomy specimens. This suggests the potential for an additional parameter to quantify and monitor the status of the cervix during pregnancy, and we are currently analyzing attenuation in the pregnant women before and after they received the ripening medicine.

This technology is exciting because it could change clinical practice. On a very basic level, obstetrical providers would be able to talk in objective terms about a woman’s cervix instead of the subject “soft, medium, or firm” designation they currently use, which would improve provider communication and thus patient care. More importantly, it could provide a means to thoroughly study normal and abnormal cervical remodeling, and associate structural changes in the cervix with molecular changes, which is the only way to discover new interventions for preterm birth.

References
1. Feltovich H, Hall TJ, and Berghella V. Beyond cervical length: Emerging technologies for assessing the pregnant cervix. Am J Obst & Gyn, 207(5): 345-354, 2012.
2. Feltovich, H and Hall TJ. Quantitative Imaging of the Cervix: Setting the Bar. Ultrasound Obstet Gynecol. 42(2): 121-128, 2013.
3. Carlson LC, Feltovich H, Palmeri ML, Dahl JJ, Del Rio AM, Hall TJ, Estimation of shear wave speed in the human uterine cervix. Ultrasound Obstet Gynecol. 43( 4): 452–458, 2014.
4. Carlson LC, Romero ST, Palmeri ML, Munoz del Rio A, Esplin SM, Rotemberg VM, Hall TJ, Feltovich H. Changes in shear wave speed pre and post induction of labor: A feasibility study. Ultrasound Obstet Gynecol.published online ahead of print Sep.2014.

1aNS2 – How an acoustic metamaterial can make a better sound absorber

Matthew D. Guild* – mdguild@utexas.edu
Victor M. García-Chocano – vicgarch@aaa.upv.es
Wave Phenomena Group
Dept. of Electronics Engineering,
Universitat Politècnica de València
Camino de vera s/n, E-46022 Valencia, Spain

Weiwei Kan – rdchkww@gmail.com
Department of Physics,
Key Laboratory of Modern Acoustics, MOE, Institute of Acoustics
Nanjing University, Nanjing 210093, People’s Republic of China

José Sánchez-Dehesa – jsdehesa@upv.es
Wave Phenomena Group
Dept. of Electronics Engineering,
Universitat Politècnica de València
Camino de vera s/n, E-46022 Valencia, Spain

* Current address: Acoustics Division, U.S. Naval Research Laboratory, Washington DC 20375, USA

Popular version of paper 1aNS2
Presented Monday morning, October 27, 2014
168th ASA Meeting, Indianapolis

From listening to music to seeing an ultrasound of a baby in the womb, sounds are all around us and are an integral part of our daily life. Many of the sounds we want to hear – such as speaking with a friend at a restaurant – but other sounds (such as conversations at nearby tables) we want to block. This unwanted sound is referred to as noise, and for many years people have worked to make different types of passive devices (that is, does not require any power to operate) to reduce the noise level we hear, such as earplugs or sound absorbing panels.

These types of devices achieve their sound absorbing properties from the materials they are made of, which is traditionally a spongy material made from soft rubbers or fabrics. While effective at absorbing sound, these materials absorb sound equally from every direction, and the acoustic properties of such a material are referred to as isotropic. For applications where the source you are interested in (musicians on stage, friend seated across from you at dinner, etc.) is in one direction, and the source of the noise comes from another direction, these traditional sound absorbers will not discriminate between what you want to hear and what you don’t. Another limitation with traditional sound absorbers is the fact that these sound absorbing materials are visually opaque and cannot be used for transparent applications (which is why most indoor musical performance spaces or recording studios do not have windows).

Unfortunately, many of these qualities of sound absorbers are limited by the physical nature of the materials themselves. However, in recent years a new class of materials has been developed for acoustical applications referred to as acoustic metamaterials. Acoustic metamaterials use the acoustic motion of its carefully designed small-scale structure to create a composite material with extreme acoustic properties. These extreme properties are the focus of current research, and are being used to develop novel applications like acoustic cloaking and lenses with super-resolution (beyond the resolution which can be achieved with an ordinary lens). In these applications currently being investigated, acoustic metamaterials have typically been modeled using ideal materials with no losses (and therefore no absorption of sound), with the presence of losses seen as a hindrance to the design. In air, these losses arise from the friction of the air oscillating through the sound absorber. For sound absorber applications, however, accounting for these losses are necessary to absorb the acoustic energy.

Recently, there has been interest in using the losses within an acoustic metamaterial to make better sound absorbers using resonant structures. These resonant structures, like the ringing of a bell, are excited at a single frequency (tone), and only work over a very limited frequency range in the vicinity of that tone. An alternative approach is the use of sonic crystals, which are a periodic distribution of small, hard rods in air. Sonic crystals by themselves act like an ordinary sound absorber, but can be arranged and designed to create structures with extraordinary acoustic properties.

In this work, the use of densely packed sonic crystals was examined to demonstrate its applicability as a sound absorber. Sonic crystal samples were designed, modeled and then fabricated using a 3D printer to be acoustically tested. By varying the size and how densely packed the sonic crystals were, acoustic experimental measurements were made and compared with predicted values. Layered arrangements were designed and fabricated, which demonstrated different sound absorbing properties in different directions and are illustrated in Fig. 1.

Fig. 1 An acoustic metamaterial sound absorber made of alternating layers (shaded in gray) with each layer consisting of circular rods (black circles) that (a) absorbs sound in one direction, but (b) lets most of the sound through in the other direction. (c) A photo of a test sample (yellow) fabricated using a commercially available 3D printer.

While only a proof of concept, this work shows that acoustic metamaterials (in this case made from sonic crystals) can be used to create sound absorbers that are not isotropic (letting sound through in one direction while absorbing it in another). At the same time, the sonic crystals can be arranged to allow some visual transparency through the arrangement of rods, and can be fabricated using commercially available techniques such as a 3D printer. More details about the modeling, design and testing of this acoustic metamaterial absorber can be found in our paper, which is available at http://arxiv.org/abs/1405.7200