3pBA4 – Artificial Intelligence for Automatic Tracking of the Tongue in Real-time Ultrasound Data

M. Hamed Mozaffari – mmoza102@uottawa.ca
Won-Sook Lee – wslee@uottawa.ca
School of Electrical Engineering and Computer Science (EECS)
University of Ottawa
800 King Edward Avenue
Ottawa, Ontario, Canada K1N 6N5

David Sankoff – sankoff@uottwa.ca
Department of Mathematics and Statistics
University of Ottawa
150 Louis Pasteur Pvt.
Ottawa, Ontario K1N 6N5

Popular version of papers 3pBA4
Presented Wednesday afternoon, December 4, 2019
178th ASA Meeting, San Diego, CA

Medical ultrasound technology has been a well-known method in speech research for studying of tongue motion and speech articulation. The popularity of ultrasound imaging for tongue visualization is because of its attractive characteristics such as imaging at a reasonably rapid frame rate, which allows researchers to visualize subtle and swift gestures of the tongue during the speech in real-time. Moreover, ultrasound technology is relatively affordable, portable and clinically safe with a non-invasive nature.

Exploiting the dynamic nature of speech data from ultrasound tongue image sequences might provide valuable information for linguistics researchers, and it is of great interest in many recent studies. Ultrasound imaging has been utilized for tongue motion analysis in the treatment of speech sound disorders, comparing healthy and impaired speech production, second language training and rehabilitation, to name a few.

During speech data acquisition, an ultrasound probe under the user’s jaw pictures tongue surface in midsagittal or coronal view in real-time. Tongue dorsum can be seen in this view as a thick, long, bright, and continues region due to the tissue-air reflection of ultrasound signal by the air around the tongue. Due to the noise characteristic of ultrasound images with the low-contrast property, it is not an easy task for non-expert users to localize the tongue surface.

tongue

Picture 1: An illustration of the human head and tongue mid-sagittal cross-section view. The tongue surface in ultrasound data can be specified using a guide curve. Highlighted lines (red and yellow) can help users to track the tongue in real-time easier.

To address this difficulty, we proposed a novel artificial intelligence method (named BowNet) for tracking the tongue surface in real-time for non-expert users. Using BowNet, users can see a highlighted version of their tongue surface in real-time during a speech without any training. This idea of tracking tongue using a contour facilitates linguistics to use the BowNet technique for their quantitative studies.

Performance of BowNet in terms of accuracy and automation is significant in comparison with similar methods as well as the capability of applying on different ultrasound data types. The real-time performance of the BowNet enables researchers to propose new second language training methods. The better performance of BowNet techniques is presented in Video 1.

Video1: A performance presentation of BowNet models in comparison to similar recent ideas. Better generalization over different datasets, less noise, and better tongue tracking can be seen. Failure cases with colour are indicated in video.

2pAA13 – Reverberation Time Slope Ratio Thesis

Michael Fay – mfay.gracenote@gmail.com
GraceNote Design Studio
7046 Temple Terrace St.
San Diego, CA 92119

Presented Tuesday afternoon, December 3, 2019
178th ASA Meeting, San Diego, CA

The T60 Slope Ratio thesis defines specific reverberation time vs. frequency goals for modern architectural acoustic environments. It is offered to advance and define a room’s acoustic design goals, and provide a simple numeric scoring scale, and adjunct grade, from which acoustical design specifications can be initiated and/or evaluated. The acronym for reverberation time is T60.

The thesis outlines a proposed standard that condenses six octaves (63 Hz – 2 kHz) of reverberant decay-time data into a single numeric score for grading indoor performance, worship and entertainment facilities. Specifically, it’s a defining metric for scoring and grading the relationship (i.e. ratio) between the longest and shortest of the six T60 values — be they measured or predicted.

Beranek’s classical Bass Ratio goals and calculations were developed to support the idea that acoustic instruments need a little extra support, via longer reverberation times, in the low-frequency range.

The modern T60 Slope Ratio goals and calculations advance the notion that those same low frequencies don’t require extra time, but rather need to be well contained. Longer low and very low-frequency (VLF) T60s are not needed or desirable when an extended-range sound reinforcement system is used.

Slope Ratio

Slope Ratio
Figure 2: Graphic Examples of 5 T60 Measurements

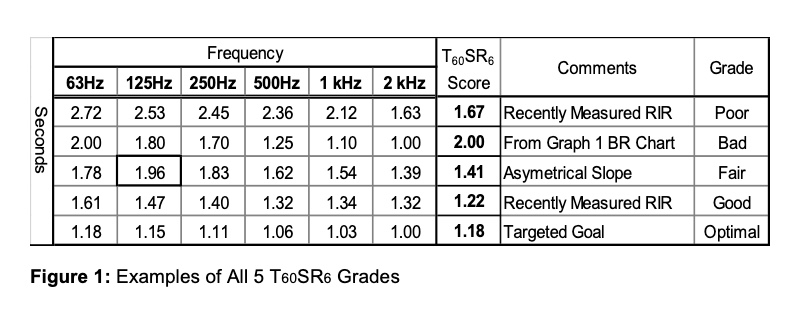
The T60 Slope Ratio is calculated by dividing the longest time by the shortest time, regardless of frequency. An optimal score has a ratio between 1.10 and 1.20.

The proposed scoring and grading scale is defined by six numeric scoring tiers from 1.00 to 1.70 and above, and five grading adjectives from Optimal to Bad. See Figure 3.

Slope RatioThese modern applications would benefit from an optimal T60SR6 grade:
♣ Performing Arts Venues
♣ Contemporary Worship Facilities
♣ Venues with Electro-acoustical Enhancement Systems
♣ Large Rehearsal Rooms

Modern VLF testing standards and treatments are lacking:
♣ The ANSI and ISO standards organizations need to develop new guidelines and standards for testing VLF absorption products and integration options.
♣ Manufacturers should make new VLF treatment products an R&D priority.

More than one hundred years ago Walter Sabine, the father of classical architectural acoustics, was concerned that music halls would soak up too much of the low-frequency energy being produced by acoustic instruments, causing audiences to complain that the music lacked body. However today, most musical styles, venues, technology, and consumer tastes and expectations have advanced far beyond anything relevant to Sabine’s concern.

The Slope Ratio Postulate: Modern loudspeakers are designed and optimized to perform as flat, or nearly flat, audio output devices. Therefore, why aren’t acousticians designing a nearly-flat T60 response for rooms in which these loudspeakers operate?

3pSA – Diagnosing wind turbine condition employing a neural network to the analysis of vibroacoustic signals

Andrzej Czyzewski
Gdansk University of Technology, Multimedia Systems Department
80-233 Gdansk, Poland
www.multimed.org
e-mail: multimed.org@gmail.com

Popular version of paper 3pSA 
Presented Wednesday afternoon, December 4, 2019
178th ASA Meeting, San Diego, California

The maintenance of wind turbines sums up to approx. 20-35% of their life-cycle costs. Therefore, it is important from the economic point of view to detect damage early in the wind turbines before failures occur. For this purpose, a monitoring system was built that analyzes both acoustic signals acquired from the non-contact acoustic intensity probe, as well as from the traditional accelerometers, mounted on the internal devices in the nacelle. The signals collected in this way are used for long-term training of the neural network. The appropriately trained network automatically detects deviations, signaling them to technical service. In this way, artificial intelligence is used to automatically monitor the technical condition of wind turbines.

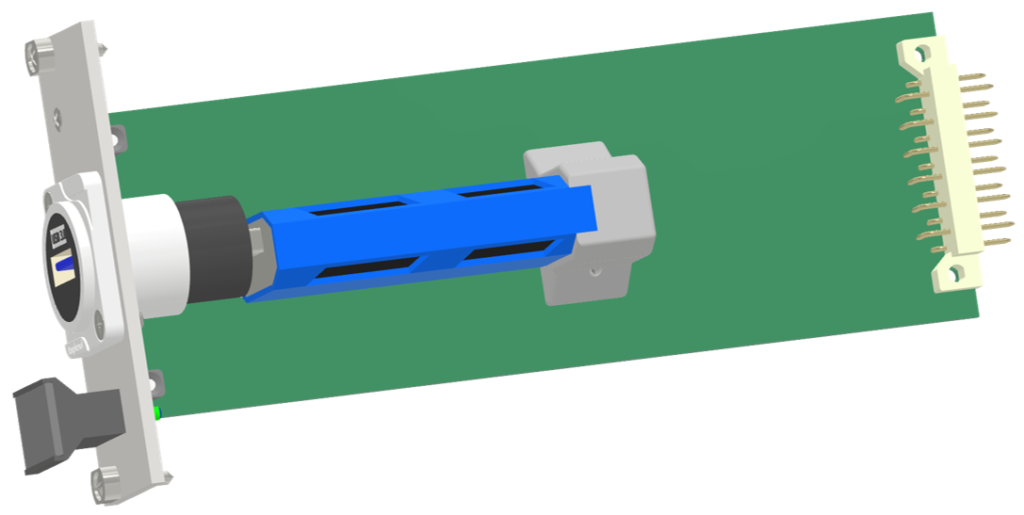
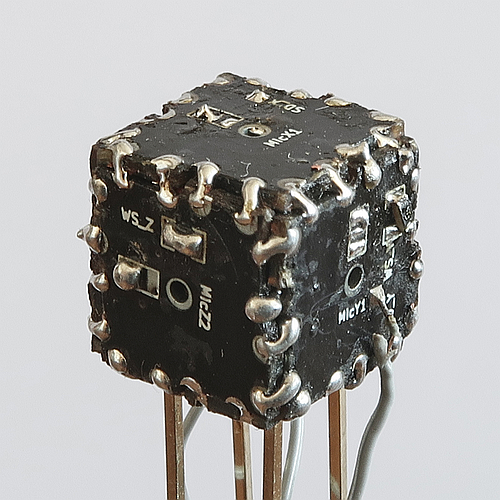
Existing methods are mostly based on different types of accelerometers mounted on the blades of the wind turbine or on the bearings of the electric power generator. Contactless methods we develop provide many benefits (e.g. no need to stop the wind turbine for mounting of accelerometers). The main source of acoustic signals obtained without contact is a special multi-microphone probe that we have constructed. A special feature of this solution is the ability to precisely determine the direction from which the sound is received. Thanks to this, the neural network learns non-mixed up sounds emitted by mechanisms located in various places inside the turbine. The acoustical probe is presented in Figure 1, and the device containing electronic circuits for processing acoustic signals is shown in Figure 2.

Figure 1 Acoustical probe (a) and complete acoustical vector sensor (b)

Figure 2 Device collecting vibroacoustic signals (a),

which also contains a neural network module that detects if these signals are abnormal (b).


In addition, we are also developing methods for visual surveillance of a wind farm, which by their nature belong to non-contact methods. We received encouraging results by amplifying the invisible vibrations in video. The method we applied is called the motion magnification in the video (invented by scientists from MIT). We used this approach for extracting information on the vibrations of the whole wind turbine construction. What comes out of this can be seen in the two short films pasted below, the first of which shows the original video image, and the second after applying the invisible pixel movements caused by vibrations and swaying of the wind turbine tower.

Video 1. Original video recording of a working wind turbine

Video 2. The same turbine as in Video 1 after applying the pixel movements magnification

Since image vibrations can be transformed into acoustic vibrations, we were able to propose a method for monitoring wind turbines using a kind of non-contact vibrometry based on video-audio technology.

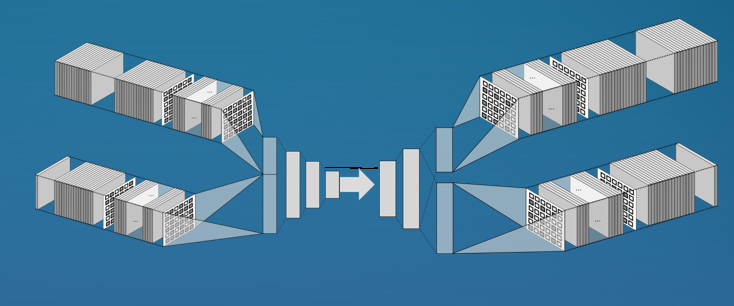
The neural network depicted in Figure 3 is the so-called autoencoder. It learns to copy its inputs to its outputs prioritizing the most relevant aspects of the data to be copied. In this way, it extracts relevant data from complex signals, so it also becomes sensitive to unexpected changes in the acoustic and video data structure. Therefore, a properly trained network can be entrusted with the task of supervising a wind turbine, i.e. checking that everything is in order with it.

Figure 3 Autoencoder neural network architecture, reflecting the principle that the encoder on the left sends only a minimal amount of relevant data, and yet the decoder on the right can reproduce the same information that the entire network sees on its inputs.

The research was subsidized by the Polish National Centre for Research and Development within the project “STEO – System for Technical and Economic Optimization of Distributed Renewable Energy Sources”, No. POIR.01.02.00-00-0357/16.

1pMU4: Reproducing tonguing strategies in single-reed woodwinds using an artificial blowing machine

Montserrat Pàmies-Vilà – pamies-vila@mdw.ac.at
Alex Hofmann – hofmann-alex@ mdw.ac.at
Vasileios Chatziioannou – chatziioannou@mdw.ac.at
University of Music and Performing Arts Vienna
Anton-von-Webern-Platz 1
1030 Vienna, Austria

Popular version of paper 1pMU4: Reproducing tonguing strategies in single-reed woodwinds using an artificial blowing machine
Presented Monday morning, May 13, 2019
177th ASA Meeting, Louisville, KY

Clarinet and saxophone players create sounds by blowing into the instrument through a mouthpiece with an attached reed, and they control the sound production by adjusting the air pressure in their mouth and the force that the lips apply to the reed. The role of the player’s tongue is to achieve different articulation styles, for example legato (or slurred), portato and staccato. The tongue touches the reed in order to stop its vibration and regulates the separation between notes. In legato the notes are played without separation, in portato the tongue shortly touches the reed and in staccato there is a longer silence between notes. A group of 11 clarinet players from the University of Music and Performing Arts Vienna (Vienna, Austria) tested these tonguing techniques with an equipped clarinet. Figure 1 shows an example of the recorded signals. The analysis revealed that the portato technique is performed similarly among players, whereas staccato requires tonguing and blowing coordination and it is more player-dependent.

Figure 1: Articulation techniques in the clarinet, played by a professional player. Blowing pressure (blue), mouthpiece sound pressure (green) and reed displacement (orange) in legato, portato and staccato articulation. Bottom right: pressure sensors placed on the clarinet mouthpiece and strain gauge on a reed.

The interest of the current study is to mimic these tonguing techniques using an artificial setup, where the vibration of the reed and the motion of the tongue can be observed. The artificial setup consists of a transparent box (artificial mouth), allowing to track the reed motion, the position of the lip and the artificial tongue. This artificial blowing-and-tonguing machine is shown in Figure 2. The build-in tonguing system is controlled with a shaker, in order to assure repeatability. The tonguing system enters the artificial mouth through a circular joint, which allows testing several tongue movements. The parameters obtained from the measurements with players are used to set up the air pressure in the artificial mouth and the behavior of the tonguing system.

Figure 2: The clarinet mouthpiece is placed through an airtight hole into a Plexiglas box. This blowing machine allows monitoring the air pressure in the box, the artificial lip and the motion of the artificial tongue, while recording the mouth and mouthpiece pressure and the reed displacement.

The signals recorded with the artificial setup were compared to the measurements obtained with clarinet players. We provide some sound examples comparing one player (first) with the blowing machine (second). A statistical analysis showed that the machine is capable of reproducing the portato articulation, achieving similar attack and release transients (the sound profile at the beginning and at the end of every note). However, in staccato articulation the blowing machine produces too fast release transients.

Comparison between a real player and the blowing machine.

This artificial blowing and tonguing set-up gives the possibility to record the essential physical variables taking part in the sound production and helps into the better understanding of the processes taking place inside the clarinetist’s mouth during playing.

2pBA2 – Double, Double, Toil and Trouble: Nitric Oxide or Xenon Bubble

Christy K. Holland – Christy.Holland@uc.edu
Department of Internal Medicine, Division of Cardiovascular Health and Disease and
Department of Biomedical Engineering
University of Cincinnati
Cardiovascular Center 3935
231 Albert Sabin Way
Cincinnati, Ohio  45267-0586
https://www.med.uc.edu/ultrasound
office:  +1 513 558 5675

Himanshu Shekhar – h.shekhar.uc@gmail.com
Department of Electrical Engineering
AB 6/327A
Indian Institute of Technology (IIT) Gandhinagar
Palaj 382355, Gujarat, India

Maxime Lafond – lafondme@ucmail.uc.edu
Department of Internal Medicine, Division of Cardiovascular Health and Disease and
Department of Biomedical Engineering
University of Cincinnati
Cardiovascular Center 3933
231 Albert Sabin Way
Cincinnati, Ohio  45267-0586

Popular version of paper 2pBA2
Presented Tuesday afternoon at 1:20 pm, May 14, 2019
177th ASA Meeting, Louisville, KY

Designer bubbles loaded with special gases are under development at the University of Cincinnati Image-guided Ultrasound Therapeutics Laboratories to treat heart disease and stroke. Xenon is a rare, pricey, heavy, noble gas, and a potent protector of a brain deprived of oxygen. Nitric oxide is a toxic gas that paradoxically plays an important role in the body, triggering the dilation of blood vessels, regulating the release and binding of oxygen in red blood cells, and even killing virus-infected cells and bacteria.

Microbubbles loaded with xenon or nitric oxide stabilized against dissolution with a fatty coating, can be exposed to ultrasound for site-specific release of these beneficial gases, as shown in the video (Supplementary Video 1). The microbubbles were stable against dissolution for for 30 minutes, which is longer than the circulation time before removal from the body. Curiously, the co-encapsulation of either of these bioactive gases with a heavier perfluorocarbon gas increased the stability of the microbubbles. Bioactive gas-loaded microbubbles act as a highlighting agent on a standard diagnostic ultrasound image (Supplementary Video 2). Triggered release was demonstrated with pulsed ultrasound already in use clinically. The total dose of xenon or nitric oxide was measured after release from the microbubbles. These results constitute the first step toward the development of ultrasound-triggered release of therapeutic gases to help rescue brain tissue during stroke.

Supplementary Video 1: High-speed video of a gas-loaded microbubble exposed to a single Doppler ultrasound pulse. Note the reduction in size over exposure to ultrasound, thus demonstrating acoustically-driven diffusion of gas out of the microbubble.

Supplementary Video 2: Ultrasound image of a rat heart filled with nitric oxide-loaded microbubbles. The chamber of the heart appears bright because of the presence of the microbubbles.