2pSC14 – Improving the Accuracy of Automatic Detection of Emotions From Speech

Reza Asadi and Harriet Fell

Popular version of poster 2pSC14 “Improving the accuracy of speech emotion recognition using acoustic landmarks and Teager energy operator features.”
Presented Tuesday afternoon, May 19, 2015, 1:00 pm – 5:00 pm, Ballroom 2
169th ASA Meeting, Pittsburgh

“You know, I can feel the fear that you carry around and I wish there was… something I could do to help you let go of it because if you could, I don’t think you’d feel so alone anymore.”
— Samantha, a computer operating system in the movie “Her”

Introduction
Computers that can recognize human emotions could react appropriately to a user’s needs and provide more human like interactions. Emotion recognition can also be used as a diagnostic tool for medical purposes, onboard car driving systems to keep the driver alert if stress is detected, a similar system in aircraft cockpits, and also electronic tutoring and interaction with virtual agents or robots. But is it really possible for computers to detect the emotions of their users?

During the past fifteen years, computer and speech scientists have worked on the automatic detection of emotion in speech. In order to interpret emotions from speech the machine will gather acoustic information in the form of sound signals, then extract related information from the signals and find patterns which relate acoustic information to the emotional state of speaker. In this study new combinations of acoustic feature sets were used to improve the performance of emotion recognition from speech. Also a comparison of feature sets for detecting different emotions is provided.

Methodology
Three sets of acoustic features were selected for this study: Mel-Frequency Cepstral Coefficients, Teager Energy Operator features and Landmark features.

Mel-Frequency Cepstral Coefficients:
In order to produce vocal sounds, vocal cords vibrate and produce periodic pulses which result in glottal wave. The vocal tract starting from the vocal cords and ending in the mouth and nose acts as a filter on the glottal wave. The Cepstrum is a signal analysis tool which is useful in separating source from filter in acoustic waves. Since the vocal tract acts as a filter on a glottal wave we can use the cepstrum to extract information only related to the vocal tract.

The mel scale is a perceptual scale for pitches as judged by listeners to be equal in distance from one another. Using mel frequencies in cepstral analysis approximates the human auditory system’s response more closely than using the linearly-spaced frequency bands. If we map frequency powers of energy in original speech wave spectrum to mel scale and then perform cepstral analysis we get Mel-Frequency Cepstral Coefficients (MFCC). Previous studies use MFCC for speaker and speech recognition. It has also been used to detect emotions.

Teager Energy Operator features:
Another approach to modeling speech production is to focus on the pattern of airflow in the vocal tract. While speaking in emotional states of panic or anger, physiological changes like muscle tension alter the airflow pattern and can be used to detect stress in speech. It is difficult to mathematically model the airflow, therefore Teager proposed the Teager Energy Operators (TEO), which computes the energy of vortex-flow interaction at each instance of time. Previous studies show that TEO related features contain information which can be used to determine stress in speech.

Acoustic landmarks:
Acoustic landmarks are locations in the speech signal where important and easily perceptible speech properties are rapidly changing. Previous studies show that the number of landmarks in each syllable might reflect underlying cognitive, mental, emotional, and developmental states of the speaker.

Asadi1 - EmotionsFigure 1 – Spectrogram (top) and acoustic landmarks (bottom) detected in neutral speech sample

Sound File 1 – A speech sample with neutral emotion

Asadi2 - Emotions

Figure 2 – Spectrogram (top) and acoustic landmarks (bottom) detected in anger speech sample

Sound File 2 – A speech sample with anger emotion


Classification:
The data used in this study came from the Linguistic Data Consortium’s Emotional Prosody and Speech Transcripts. In this database four actresses and three actors, all in their mid-20s, read a series of semantically neutral utterances (four-syllable dates and numbers) in fourteen emotional states. A description for each emotional state was handed over to the participants to be articulated in the proper emotional context. Acoustic features described previously were extracted from the speech samples in this database. These features were used for training and testing Support Vector Machine classifiers with the goal of detecting emotions from speech. The target emotions included anger, fear, disgust, sadness, joy, and neutral.

Results
The results of this study show an average detection accuracy of approximately 91% among these six emotions. This is 9% better than a previous study conducted at CMU on the same data set.

Specifically TEO features resulted in improvements in detecting anger and fear and landmark features improved the results for detecting sadness and joy. The classifier had the highest accuracy, 92%, in detecting anger and the lowest, 87%, in detecting joy.

Accents: Hard to Understand, Harder to Remember

Hard to Understand, Harder to Remember

In a study, native English speakers had more difficulty recalling words spoken in an unfamiliar Korean accent, suggesting that the effort listeners put into understanding a foreign accent may lessen their ability to process the information.

WASHINGTON, D.C., May 18, 2015 — Struggling to understand someone else talking can be a taxing mental activity. A wide range of studies have already documented that individuals with hearing loss or who are listening to degraded speech — for example over a bad phone line or in a loud room — have greater difficulty remembering and processing the spoken information than individuals who heard more clearly.

Now researchers at Washington University in St. Louis are investigating the relatively unexplored question of whether listening to accented speech similarly affects the brain’s ability to process and store information. Their preliminary results suggest that foreign-accented speech, even when intelligible, may be slightly more difficult to recall than native speech.

The researchers will present their findings at the 169th meeting of the Acoustical Society of America, held May 18 – 22 in Pittsburgh, Pennsylvania.

Listening to accented speech is different than other more widely studied forms of “effortful listening” — think loud cocktail parties — because the accented speech itself deviates from listener expectations in (often) systematic ways, said Kristin Van Engen, a post-doctoral research associate in the linguistics program at Washington University in St. Louis.

How the brain processes information delivered in an accent has relevance to real-world settings like schools and hospitals. “If you’re working hard to understand a professor or doctor with a foreign accent, are you going to have more difficulty encoding the information you’re learning in memory?” Van Engen asked. The answer is not really known, and the issue has received relatively little attention in either the scientific literature on foreign accent processing or the literature on effortful listening, she said.

To begin to answer her question, Van Engen and her colleagues tested the ability of young-adult native English speakers to store spoken words in their short-term memory. The test subjects listened to lists of English words, voiced either with a standard American accent or with a pronounced, but still intelligible Korean accent. After a short time the lists would randomly stop and the listeners were asked to recall the last three words they had heard.

All the volunteer listeners selected for the study were unfamiliar with a Korean accent.

The listeners’ rate of recall for the most recently heard words was similarly high with both accents, but Van Engen and her team found that volunteers remembered the third word back only about 70 percent of the time when listening to a Korean accent, compared to about 80 percent when listening to a standard American accent.

All of the words spoken with the accent had been previously tested to ensure that they were understandable before they were used in the experiment, Van Engen said. The difference in recall rates might be due to the brain using some of its executive processing regions, which are generally used to focus attention and integrate and store information, to understand words spoken in an unfamiliar accent, Van Engen said.

The results are preliminary, and Van Engen and her team are working to gather data on larger sets of listeners, as well as to test other brain functions that require processing spoken information, such as listening to a short lecture and later recalling and using the concepts discussed. She said work might also be done to explore whether becoming familiar with a foreign accent would lessen the observed difference in memory functions.

Van Engen hopes the results might help shape strategies for both listeners and foreign accented speakers to better communicate and ensure that the information they discussed is remembered. For example, it might help listeners to use standard strategies such as looking at the person speaking and asking for repetition. Accented speakers might be able to improve communication by talking more slowing or working to match their intonation, rhythm and stress patterns more closely to that of native speakers, Van Engen said.

———————– MORE MEETING INFORMATION ———————–
USEFUL LINKS
Main meeting website: https://acousticalsociety.org/asa-meetings/
Press Room: https://acoustics.org/world-wide-press-room/

WORLDWIDE PRESS ROOM
In the coming weeks, ASA’s Worldwide Press Room will be updated with additional tips on dozens of newsworthy stories and with lay language papers, which are 300 to 500 word summaries of presentations written by scientists for a general audience and accompanied by photos, audio and video. You can visit the site during the meeting at https://acoustics.org/world-wide-press-room/.

PRESS REGISTRATION
We will grant free registration to credentialed journalists and professional freelance journalists. If you are a reporter and would like to attend, contact AIP Media Services at media@aip.org. For urgent requests, staff at media@aip.org can also help with setting up interviews and obtaining images, sound clips, or background information.

ABOUT THE ACOUSTICAL SOCIETY OF AMERICA
The Acoustical Society of America (ASA) is the premier international scientific society in acoustics devoted to the science and technology of sound. Its 7,000 members worldwide represent a broad spectrum of the study of acoustics. ASA publications include The Journal of the Acoustical Society of America (the world’s leading journal on acoustics), JASA Express Letters, Proceedings of Meetings on Acoustics, Acoustics Today magazine, books, and standards on acoustics. The society also holds two major scientific meetings each year. See https://acousticalsociety.org/.

2aSC8 – Some people are eager to be heard: anticipatory posturing in speech production

Sam Tilsen – tilsen@cornell.edu
Peter Doerschuk – pd83@cornell.edu
Wenming Luh – wl358@cornell.edu
Robin Karlin – rpk83@cornell.edu
Hao Yi – hy433@cornell.edu
Cornell University
Ithaca, NY 14850

Pascal Spincemaille – pas2018@med.cornell.edu
Bo Xu – box2001@med.cornell.edu
Yi Wang – yiwang@med.cornell.edu
Weill Medical College
New York, NY 10065

Popular version of paper 2aSC8
Presented Tuesday morning, October 28, 2014
168th ASA Meeting, Indianapolis
See also: A real-time MRI investigation of anticipatory posturing in prepared responses

Consider a common scenario in a conversation: your friend is in the middle of asking you a question, and you already know the answer. To be polite, you wait to respond until your friend finishes the question. But what are you doing while you are waiting?

You might think that you are passively waiting for your turn to speak, but the results of this study suggest that you may be more impatient than you think. In analogous circumstances recreated experimentally, speakers move their vocal organs—i.e. their tongues, lips, and jaw—to positions that are appropriate for the sounds that they intend to produce in the near future. Instead of waiting passively for their turn to speak, they are actively preparing to respond.

To examine how speakers control their vocal organs prior to speaking, this study used real-time magnetic resonance imaging of the vocal tract. This recently developed technology takes a picture of tissue in middle of the vocal tract, much like an x-ray, and it takes the picture about 200 times every second. This allows for measurement of rapid changes in the positions of vocal organs before, during, and after people are speaking.

A video is available online (http://youtu.be/h2_NFsprEF0).

To understand how changes in the positions of vocal organs are related to different speech sounds, it is helpful to think of your mouth and throat as a single tube, with your lips at one end and the vocal folds at the other. When your vocal folds vibrate, they create sound waves that resonate in this tube. By using your lips and tongue to make closures or constrictions in the tube, you can change the frequencies of the resonating sound waves. You can also use an organ called the velum to control whether sound resonates in your nasal cavity. These relations between vocal tract postures and sounds provide a basis for extracting articulatory features from images of the vocal tract. For example, to make a “p” sound you close your lips, to make an “m” sound you close your lips and lower your velum, and to make “t” sound you press the tip of the tongue against the roof of your mouth.

Participants in this study produced simple syllables with a consonant and vowel (such as “pa” and “na”) in several different conditions. In one condition, speakers knew ahead of time what syllable to produce, so that they could prepare their vocal tract specifically for the response. In another condition, they produced the syllable immediately without any time for response-specific preparation. The experiment also manipulated whether speakers were free to position their vocal organs however they wanted before responding, or whether they were constrained by the requirement to produce the vowel “ee” before their response.

All of the participants in the study adopted a generic “speech-ready” posture prior to making a response, but only some of them adjusted this posture specifically for the upcoming response. This response-specific anticipation only occurred when speakers knew ahead of time exactly what response to produce. Some examples of anticipatory posturing are shown in the figures below.
anticipatory posture

Figure 2. Examples of anticipatory postures for “p” and “t” sounds. The lips are closer together in anticipation of “p” and the tongue tip is raised in anticipation of “t”.
anticipatory
Figure 3. Examples of anticipatory postures for “p” and “m” sounds. The velum is raised in anticipation of “p” and lowered in anticipation of “m”.

The surprising finding of this study was that only some speakers anticipatorily postured their vocal tracts in a response-specific way, and that speakers differed greatly in which vocal organs they used for this purpose. Furthermore, some of the anticipatory posturing that was observed facilitates production of an upcoming consonant, while other anticipatory posturing facilitates production of an upcoming vowel. The figure below summarizes these results.
anticipatory
Figure 4. Summary of anticipatory posturing effects, after controlling for generic speech-ready postures.

Why do some people anticipate vocal responses while others do not? Unfortunately, we don’t know: the finding that different speakers use different vocal organs to anticipate different sounds in an upcoming utterance is challenging to explain with current models of speech production. Future research will need to investigate the mechanisms that give rise to anticipatory posturing and the sources of variation across speakers.

4pAAa10 – Eerie voices: Odd combinations, extremes, and irregularities

Brad Story – bstory@email.arizona.edu
Dept. of Speech, Language, and Hearing Sciences
University of Arizona
P.O. Box 210071
Tucson, AZ 85712

Popular version of paper 4pAAa10
Presented Thursday afternoon, October 30, 2014
168th ASA Meeting, Indianapolis

The human voice is a pattern of sound generated by both the mind and body, and carries with it information about about a speaker’s mental and physical state. Qualities such as gender, age, physique, dialect, health, and emotion are often embedded in the voice, and can produce sounds that are comforting and pleasant, intense and urgent, sad and happy, and so on. The human voice can also project a sense of eeriness when the sound contains qualities that are human-like, but not necessarily typical of the speech that is heard on a daily basis. A person with an unusually large head and neck, for example, may produce highly intelligible speech, but it will be oddly dominated by low frequency sounds that belie the atypical size of the talker. Excessively slow or fast speaking rates, strangely-timed and irregular speech, as well as breathiness and tremor may all also contribute to an eeriness if produced outside the boundaries of typical speech.

The sound pattern of the human voice is produced by the respiratory system, the larynx, and the vocal tract. The larynx, located at the bottom of the throat, is comprised of a left and right vocal fold (often referred to as vocal cords) and a surrounding framework of cartilage and muscle. During breathing the vocal folds are spread far apart to allow for an easy flow of air to and from the lungs. To generate sound they are brought together firmly, allowing air pressure to build up below them. This forces the vocal folds into vibration, creating the sound waves that are the “raw material” to be formed into speech by the vocal tract. The length and mass of the vocal folds largely determine the vocal pitch and vocal quality. Small and light vocal folds will generally produce a high pitched sound, whereas low pitch typically originate with large, heavy vocal folds.

The vocal tract is the airspace created by the throat and the mouth whose shape at any instant of time depends on the positions of the tongue, jaw, lips, velum, and larynx. During speech it is a continuously changing tube-like structure that “sculpts” the raw sound produced by the vocal folds into a stream of vowels and consonants. The size and shape of the vocal tract imposes another layer of information about the talker. A long throat and large mouth may transmit the impression of a large body while more subtle characteristics like the contour of the roof of the mouth may add characteristics that are unique to the talker.

For this study, speech was simulated with a mathematical representation of the vocal folds and vocal tract. Such simulations allow for modifications of size and shape of structures, as well as temporal aspects of speech. The goal was to simulate extremes in vocal tract length, unusual timing patterns of speech movements, and odd combinations of breathiness and tremor. The result can be both eerie and amusing because the sounds produced are almost human, but not quite.

Three examples are included to demonstrate these effects. The first is set of seven simulations of the word “abracadabra” produced while gradually decreasing the vocal tract length from 22 cm to 6.6 cm, increasing the vocal pitch from very low to very high, and increasing the speaking rate from slow to fast. The longest and shortest vocal tracts are shown in Figure 1 and are both configured as “ah” vowels; for production of the entire word, the vocal tract shape continuously changes. The set of simulations can be heard in sound sample 1.

Although it may be tempting to assume that the changes present in sound sample 1 are similar to simply increasing the playback speed of the audio, the changes are based on physiological scaling of the vocal tract, vocal folds, as well as an increase in the speaking rate. Sound sample 2 contains the same seven simulations except that the speaking rate is exactly the same in each case, eliminating the sense of increased playback speed.

The third example demonstrates the effects of modifying the timing of the vowels and consonants within the word “abracadabra” while simultaneously adding a shaky or tremor-like quality, and an increased amount of breathiness. A series of six simulations can be heard in sound sample 3; the first three versions of the word are based on the structure of an unusually large male talker, whereas the second three are representative of an adult female talker.

This simulation model used for these demonstrations has been developed for purposes of studying and understanding human speech production and speech development. Using the model to investigate extreme cases of structure and unusual timing patterns is useful for better understanding the limits of human speech.

story

Figure 1 caption:
Unnaturally long and short tube-like representations of the human vocal tract. Each vocal tract is configured as an “ah” vowel (as in “hot”), but during speech the vocal tract continuously changes shape. Vocal tract lengths for typical adult male and adult female talkers are approximately 17.5 cm and 15 cm, respectively. Thus, the 22 cm long tract would be representative of a person with an unusually large head and neck, whereas the 6.6 cm vocal tract is even shorter than a typical infant.

4aSCb8 – How do kids communicate in challenging conditions?

Valerie Hazan – v.hazan@ucl.ac.uk
University College London (UCL)
Speech Hearing and Phonetic Sciences
Gower Street, London WC1E 6BT, UK

Michèle Pettinato – Michele.Pettinato@uantwerpen.be
University College London (UCL)
Speech Hearing and Phonetic Sciences
Gower Street, London WC1E 6BT, UK

Outi Tuomainen – o.tuomainen@ucl.ac.uk
University College London (UCL)
Speech Hearing and Phonetic Sciences
Gower Street, London WC1E 6BT, UK

Sonia Granlund – s.granlund@ucl.ac.uk
University College London (UCL)
Speech Hearing and Phonetic Sciences
Gower Street, London WC1E 6BT, UK

Popular version of 4aSCb8 – Acoustic-phonetic characteristics of older children’s spontaneous speech in interactions in conversational and clear speaking styles
Presented Thursday morning, October 30, 2014
168th ASA Meeting, Indianapolis

Kids learn to speak fluently at a young age and we expect young teenagers to communicate as effectively as adults. However, researchers are increasingly realizing that certain aspects of speech communication have a slower developmental path. For example, as adults, we are very skilled at adapting the way that we speak according to the needs of the communication. When we are speaking a predictable message in good listening conditions, we do not need to make an effort to pronounce speech clearly and we can expend less effort. However, in poor listening conditions or when transmitting new information, we increase the effort that we make to enunciate speech clearly in order to be more easily understood.

In our project, we investigated whether 9 to 14 year olds (divided into three age bands) were able to make such skilled adaptations when speaking in challenging conditions. We recorded 96 pairs of friends of the same age and gender while they carried out a simple picture-based ‘spot the difference’ game (See Figure 1).
Hazan1_fig
Figure 1: one of the picture pairs in the DiapixUK ‘spot the difference’ task.

The two friends were seated in different rooms and spoke to each other via headphones; they had to try to find 12 differences between their two pictures without seeing each other or the other picture. In the ‘easy communication’ condition, both friends could hear each other normally, while in the ‘difficult communication’ condition, we made it difficult for one of the friends (‘Speaker B’) to hear the other by heavily distorting the speech of ‘Speaker A’ using a vocoder (See Figure 2 and sound demos 1 and 2). Both kids had received some training at understanding this type of distorted speech. We investigated what adaptations Speaker A, who was hearing normally, made to his or her speech in order to make themselves understood by their friend with ‘impaired’ hearing, so that they could complete the task successfully.
Hazan2_fig
Figure 2: The recording set up for the ‘easy communication’ (NB) and ‘difficult communication’ (VOC) conditions.

Sound 1: Here, you will hear an excerpt from the diapix task between two 10 year olds in the ‘difficult communication’ conversation from the viewpoint of the talker hearing normally. Hear how she attempts to clarify her speech when her friend has difficulty understanding her.

Sound 2: Here, you will hear the same excerpt but from the viewpoint of the talker hearing the heavily degraded (vocoded) speech. Even though you will find this speech very difficult to understand, even 10 year olds get better at perceiving it after a bit of training. However, they are still having difficulty understanding what is being said, which forces their friend to make greater effort to communicate.

We looked at the time it took to find the differences between the pictures as a measure of communication efficiency. We also carried out analyses of the acoustic aspects of the speech to see how these varied when communication was easy or difficult.

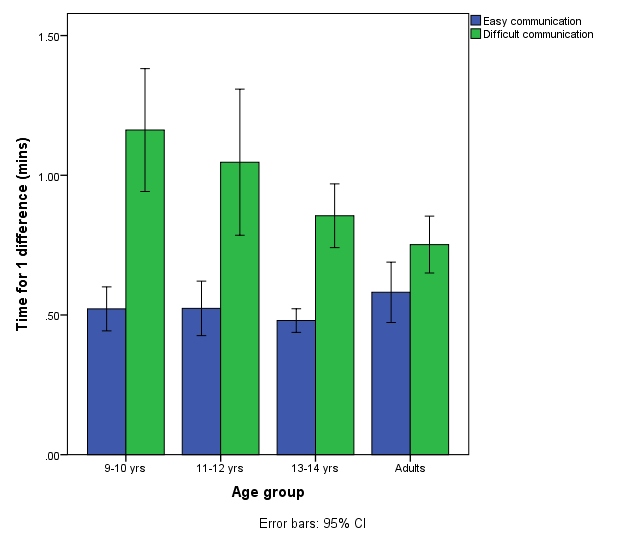
We found that when communication was easy, the child groups did not differ from adults in the average time that it took to find a difference in the picture, showing that 9 to 14 year olds were communicating as efficiently as adults. When the speech of Speaker A was heavily distorted, all groups took longer to do the task, but only the 9-10 year old group took significantly longer than adults (See Figure 3). The additional problems experienced by younger kids are likely to be due both to greater difficulty for Speaker B in understanding degraded speech and to Speaker A being less skilled at compensating for this difficulties. The results obtained for children aged 11 and older suggest that they were using good strategies to compensate for the difficulties imposed on the communication (See Figure 3).
Hazan3_fig
Figure 3: Average time taken to find one difference in the picture task. The four talker groups do not differ when communication is easy (blue bars); in the ‘difficult communication’ condition (green bars), the 9-10 years olds take significantly longer than the adults but the other child groups do not.

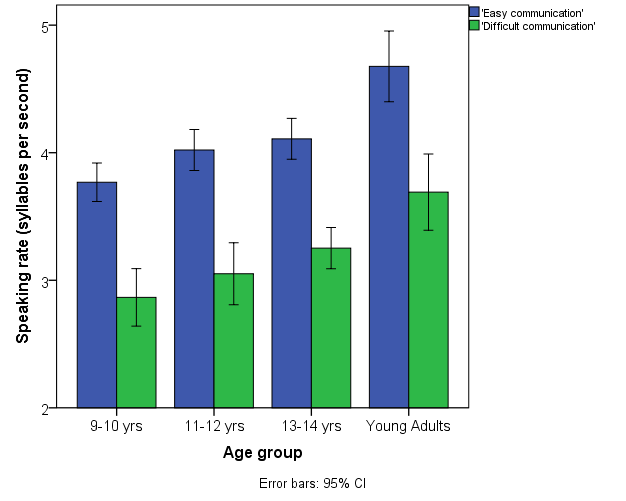
In terms of the acoustic characteristics of their speech, the 9 to 14 year olds differed in certain aspects from adults in the ‘easy communication’ condition. All child groups produced more distinct vowels and used a higher pitch than adults; kids younger than 11-12 also spoke more slowly and more loudly than adults. They hadn’t learnt to ‘reduce’ their speaking effort in the way that adults would do when communication was easy. When communication was made difficult, the 9 to 14 year olds were able to make adaptations to their speech for the benefit of their friend hearing the distorted speech, even though they themselves were having no hearing difficulties. For example, they spoke more slowly (See Figure 4) and more loudly. However, some of these adaptations differed from those produced by adults.
Hazan4_fig
Figure 4: Speaking rate changes with age and communication difficulty. 9-10 year olds spoke more slowly than adults in the ‘easy communication’ condition (blue bars). All speaker groups slowed down their speech as a strategy to help their friend understand them in the ‘difficult communication’ (vocoder) condition (green bars).

Overall, therefore, even in the second decade of life, there are changes taking place in the conversational speech produced by young people. Some of these changes are due to physiological reasons such as growth of the vocal apparatus, but increasing experience with speech communication and cognitive developments occurring in this period also play a part.

Younger kids may experience greater difficulty than adults when communicating in difficult conditions and even though they can make adaptations to their speech, they may not be as skilled at compensating for these difficulties. This has implications for communication within school environments, where noise is often an issue, and for communication with peers with hearing or language impairments.

1aSC9 – Challenges when using mobile phone speech recordings as evidence in a court of law

Balamurali B. T. Nair – bbah005@aucklanduni.ac.nz
Esam A. Alzqhoul – ealz002@aucklanduni.ac.nz
Bernard J. Guillemin – bj.guillemin@auckland.ac.nz

Dept. of Electrical & Computer Engineering,
Faculty of Engineering,
The University of Auckland,
Private Bag 92019, Auckland Mail Centre,
Auckland 1142, New Zealand.

Phone: (09) 373 7599 Ext. 88190
DDI: (09) 923 8190
Fax: (09) 373 7461

Popular version of paper 1aSC9 Impact of mismatch conditions between mobile phone recordings on forensic voice comparison
Presented Monday morning, October 27, 2014
168th ASA Meeting, Indianapolis

When Motorola’s vice president, Martin Cooper, made his first call from a mobile phone device, which priced about four thousand dollars back in 1983, one could not have imagined then that in just a few decades mobile phones would become a crucial and ubiquitous part of everyday life. Not surprisingly this technology is also being increasingly misused by the criminal fraternity to coordinate their activities, which range from threatening calls, to ransoms and even bank frauds and robberies.

Recordings of mobile phone conversations can sometimes be presented as major pieces of evidence in a court of law. However, identifying a criminal by their voice is not a straight forward task and poses many challenges. Unlike DNA and finger prints, an individual’s voice is far from constant and exhibits changes as a result of a wide range of factors. For example, the health condition of a person can substantially change his/her voice, and as a result the same words spoken on one occasion would sound different on another.

The process of comparing voice samples and then presenting the outcome to a court of law is technically known as forensic voice comparison. This process begins by extracting a set of features from the available speech recordings of an offender, whose identity obviously is unknown, in order to capture information that is unique to their voice. These features are then compared using various procedures with those of the suspect charged with the offence.

One approach that is becoming widely accepted nowadays amongst forensic scientists for undertaking forensic voice comparison is known as the likelihood ratio framework. The likelihood ratio addresses two different hypotheses and estimates their associated probabilities. First is the prosecution hypothesis which states that suspect and offender voice samples have the same origin (i.e., suspect committed the crime). Second is the defense hypothesis that states that the compared voice samples were spoken by different people who just happen to sound similar.

When undertaking this task of comparing voice samples, forensic practitioners might erroneously assume that mobile phone recordings can all be treated in the same way, irrespective of which mobile phone network they originated from. But this is not the case. There are two major mobile phone technologies currently in use today: the Global System for Mobile Communications (GSM) and Code Division Multiple Access (CDMA), and these two technologies are fundamentally different in the way they process speech. One difference, for example, is that the CDMA network incorporates a procedure for reducing the effect of background noise picked up by the sending-end mobile microphone, whereas the GSM network does not. Therefore, the impact of these networks on voice samples is going to be different, which in turn will impact the accuracy of any forensic analysis undertaken.

Having two mobile phone recordings, one for the suspect and another for the offender that originate from different networks represent a typical scenario in forensic case work. This situation is normally referred to as a mismatched condition (see Figure 1). Researchers at the University of Auckland, New Zealand, have conducted a number of experiments to investigate in what ways and to what extent such mismatch conditions can impact the accuracy and precision of a forensic voice comparison. This study used speech samples from 130 speakers, where the voice of each speaker had been recorded on three occasions, separated by one month intervals. This was important in order to account for the variability in a person’s voice which naturally occurs from one occasion to another. In these experiments the suspect and offender speech samples were processed using the same speech codecs as used in the GSM and CDMA networks. Mobile phone networks use these codecs to compress speech in order to minimize the amount of data required for each call. Not only this, the speech codec dynamically interacts with the network and changes its operation in response to changes occurring in the network. The codecs in these experiments were set to operate in a manner similar to what happens in a real, dynamically changing, mobile phone network.

mobile phone

Typical scenario in a forensic case work

The results suggest that the degradation in the accuracy of a forensic analysis under mismatch conditions can be very significant (as high as 150%). Surprisingly, though, these results also suggest that the precision of a forensic analysis might actually improve. Nonetheless, precise but inaccurate results are clearly undesirable. The researchers have proposed a strategy for lessening the impact of mismatch by passing the suspect’s speech samples through the same speech codec as the offender’s (i.e., either GSM or CDMA) prior to forensic analysis. This strategy has been shown to improve the accuracy of a forensic analysis by about 70%, but performance is still not as good as analysis under matched conditions.