Lucky Tsaih, Yosua W. Tedja, An-Chi Tsai, Julie Chen Department of Architecture, National Taiwan University of Science and Technology, Taipei, Taiwan.
1pAAa6 – Soundscape of washroom equipment and its application Jun 25, 2017 173rd Meeting of the Acoustical Society of America and the 8th Forum Acusticum Click here to read the abstract
There is at least one toilet in your apartment, sometimes two for a house or even three toilets for a midrise building. There are lots of toilets are in school. Wow! Toilets are everywhere! How loud is a toilet flush sound?
Audio 1. Credit: Tedja
It is about 92 decibels. Since human hearing is less sensitive in lower frequency regions, we only hear it as about 85 decibels. 85 decibels is as loud as a truck driving by in front of you. Since most people desire to sleep, work, and study in a quiet space, when someone flushes a toilet, our sleeping can be disturbed or our concentration broken.
Figure 1. Toilet sound and quiet space. Credit: Tsaih
Thus, how good is your washroom wall, door and window at reducing the toilet flush sound while you are sleeping, working or studying? As in most cases, a typical single layer of gypsum board wall is used and doesn’t reduce much of the low frequency sound, as Figure 2 shows.
Figure 2. Toilet sound and sound reduction of a typical GWB wall. Credit: Tsaih
So, during work, study or sleep, you will still probably hear the “hmmmmmmm” sound. The simulated sound below assumes there are only walls, and no windows or doors in the washroom.
This research is to show how loud the washroom equipment sound can be and what kind of proper noise control an architect should consider using when designing washrooms in spaces like bedrooms and classrooms. We measured and analyzed sound pressure levels of washroom equipment. We also analyzed sound transmission class and its frequency spectrum of some typical washroom partitions to see if these partitions could reduce washroom equipment sound sufficiently.
Audio 2. Credit: Tedja
Figure 3. Toilet sound in study room and bedroom. Credit: Tsai
In short, a wall that blocks toilet flush sound is necessary in our homes, classes, and offices. Figure 4. Learning and sleeping with toilet flush sound. Credit: Tedja and Chen
Ashlee Lillis – ashlee@whoi.edu T. Aran Mooney – amooney@whoi.edu
Marine Research Facility Woods Hole Oceanographic Institution 266 Woods Hole Road Woods Hole, MA 02543
Popular version of paper 2pABa1 Presented Tuesday afternoon, November 29, 2016 172nd ASA Meeting, Honolulu
Characteristic soundscape recorded on a coral reef in St. John, US Virgin Islands. The conspicuous crackle is produced by many tiny snapping shrimp.
Put your head underwater in almost any tropical or sub-tropical coastal area and you will hear a continuous, static-like noise filling the water. The source of this ubiquitous sizzling sound found in shallow-water marine environments around the world was long considered a mystery of the sea. It wasn’t until WWII investigations of this underwater sound, considered troublesome, that hidden colonies of a type of small shrimp were discovered as the cause of the pervasive crackling sounds (Johnson et al., 1947).
Individual snapping shrimp (Figure 1), sometimes referred to as pistol shrimp, measure smaller than a few centimeters, but produce one of the loudest of all sounds in nature using a specialized snapping claw. The high intensity sound is actually the result of a bubble popping when the claw is closed at incredibly high speed, creating not only the characteristic “snap” sound but also a flash of light and extremely high temperature, all in a fraction of a millisecond (Versluis et al., 2000). Because these shrimp form large, dense aggregations, living unseen within reefs and rocky habitats, the combination of individual snaps creates the consistent crackling sound familiar to mariners. Snapping is used by shrimp for defense and territorial interactions, but likely serves other unknown functions based on our recent studies.
Figure 1. Images of the species of snapping shrimp, Alpheus heterochaelis, we are using to test hypotheses in the lab. This is the dominant species of snapping shrimp found coastally in the Southeast United States, but there are hundreds of different species worldwide, easily identified by their relatively large snapping claw.
Since snapping shrimp produce the dominant sound in many marine regions, changes in their activity or population substantially alters ambient sound levels at a given location or time. This means that the behavior of snapping shrimp exerts an outsized influence on the sensory environment for a variety of marine animals, and has implications for the use of underwater sound by humans (e.g., harbor defense, submarine detection). Despite this fundamental contribution to the acoustic environment of temperate and coral reefs, relatively little is known about snapping shrimp sound patterns, and the underlying behaviors or environmental influences. So essentially, we ask the question: what is all the snapping about?
Figure 2 (missing). Photo showing an underwater acoustic recorder deployed in a coral reef setting. Recorders can be left to record sound samples at scheduled times (e.g. every 10 minutes) so that we can examine the long-term temporal trends in snapping shrimp acoustic activity on the reef.
Recent advances in underwater recording technology and interest in passive acoustic monitoring have aided our efforts to sample marine soundscapes more thoroughly (Figure 2), and we are discovering complex dynamics in snapping shrimp sound production. We collected long-term underwater recordings in several Caribbean coral reef systems and analyzed the snapping shrimp snap rates. Our soundscape data show that snap rates generally exhibit daily rhythms (Figure 3), but that these rhythms can vary over short spatial scales (e.g., opposite patterns between nearby reefs) and shift substantially over time (e.g., daytime versus nighttime snapping during different seasons). These acoustic patterns relate to environmental variables such as temperature, light, and dissolved oxygen, as well as individual shrimp behaviors themselves.
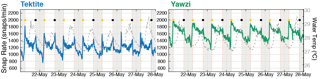
Figure 3. Time-series of snap rates detected on two nearby USVI coral reefs for a week-long recording period. Snapping shrimp were previously thought to consistently snap more during the night, but we found in this study location that shrimp were more active during the day, with strong dawn and dusk peaks at one of the sites. This pattern conflicts with what little is known about snapping behaviors and is motivating further studies of why they snap.
The relationships between environment, behaviors, and sound production by snapping shrimp are really only beginning to be explored. By listening in on coral reefs, our work is uncovering intriguing patterns that suggest a far more complex picture of the role of snapping shrimp in these ecosystems, as well as the role of snapping for the shrimp themselves. Learning more about the diverse habits and lifestyles of snapping shrimp species is critical to better predicting and understanding variation in this dominant sound source, and has far-reaching implications for marine ecosystems and human applications of underwater sound.
References
Johnson, M. W., F. Alton Everest, and Young, R. W. (1947). “The role of snapping shrimp (Crangon and Synalpheus) in the production of underwater noise in the sea,” Biol. Bull. 93, 122–138.
Versluis, M., Schmitz, B., von der Heydt, A., and Lohse, D. (2000). “How snapping shrimp snap: through cavitating bubbles,” Science, 289, 2114–2117. doi:10.1126/science.289.5487.2114
W.M. To – wmto@ipm.edu.mo Macao Polytechnic Institute, Macao SAR, China. A. Chung – ac@smartcitymakter.com Smart City Maker, Denmark. B. Schulte-Fortkamp – b.schulte-fortkamp@tu-berlin.de Technische Universität Berlin, Berlin, Germany.
Popular version of paper 2aNS, “How virtual reality technologies can enable better soundscape design” Presented Tuesday morning, November 29, 2016 172nd ASA Meeting, Honolulu
The quality of life including good sound quality has been sought by community members as part of the smart city initiative. While many governments have placed special attention to waste management, air and water pollution, acoustic environment in cities has been directed toward the control of noise, in particular, transportation noise. Governments that care about the tranquility in cities rely primarily on setting the so-called acceptable noise levels i.e. just quantities for compliance and improvement [1]. Sound quality is most often ignored. Recently, the International Organization for Standardization (ISO) released the standard on soundscape [2]. However, sound quality is a subjective matter and depends heavily on the perception of humans in different contexts [3]. For example, China’s public parks are well known to be rather noisy in the morning due to the activities of boisterous amateur musicians and dancers – many of them are retirees and housewives – or “Da Ma” [4]. These activities would cause numerous complaints if they would happen in other parts of the world, but in China it is part of everyday life.
According to the ISO soundscape guideline, people can use sound walks, questionnaire surveys, and even lab tests to determine sound quality during a soundscape design process [3]. With the advance of virtual reality technologies, we believe that the current technology enables us to create an application that immerses designers and stakeholders in the community to perceive and compare changes in sound quality and to provide feedback on different soundscape designs. An app has been developed specifically for this purpose. Figure 1 shows a simulated environment in which a student or visitor arrives the school’s campus, walks through the lawn, passes a multifunctional court, and get into an open area with table tennis tables. She or he can experience different ambient sounds and can click an object to increase or decrease the volume of sound from that object. After hearing sounds at different locations from different sources, the person can evaluate the level of acoustic comfort at each location and express their feelings toward overall soundscape. She or he can rate the sonic environment based on its degree of perceived loudness and its level of pleasantness using a 5-point scale from 1 = ‘heard nothing/not at all pleasant’ to 5 = ‘very loud/pleasant’. Besides, she or he shall describe the acoustic environment and soundscape using free words because of the multi-dimensional nature of sonic environment.
Figure 1. A simulated soundwalk in a school campus.
To, W. M., Mak, C. M., and Chung, W. L.. Are the noise levels acceptable in a built environment like Hong Kong? Noise and Health, 2015. 17(79): 429-439.
ISO. ISO 12913-1:2014 Acoustics – Soundscape – Part 1: Definition and Conceptual Framework, Geneva: International Organization for Standardization, 2014.
Kang, J. and Schulte-Fortkamp, B. (Eds.). Soundscape and the Built Environment, CRC Press, 2016.
Suzi Wiseman – sw1210txstate@gmail.com Texas State University-San Marcos Environmental Geography 601 University Drive, San Marcos, Texas 78666 Preston S. Wilson – wilsonps@austin.utexas.edu University of Texas at Austin Mechanical Engineering Department 1 University Station C2200 Austin, TX 78712
Popular version of paper 2aAB7, “Nocturnal peace at a Conservation Center for Species Survival?” Presented Tuesday morning, May 19, 2015 at 10.15am 169th ASA Meeting, Pittsburgh
The acoustic environment is essential to wildlife, providing vital information about prey and predators and the activities of other living creatures (biophonic information) (Wilson, 1984), about changing weather conditions and occasionally geophysical movement (geophonic), and about human activities (anthrophonic) (Krause 1987). Small sounds can be as critical as loud, depending on the species trying to listen. Some hear infrasonically (too low for humans, generally considered below 20 Hz), others ultrasonically (too high, above 20 kHz). Biophonic soundscapes frequently exhibit temporal and seasonal patterns, for example a dawn “chorus”, mating and nurturing calls, diurnal and crepuscular events.
Some people are attracted to large parks due in part to their “peace and quiet” (McKenna 2013). But even in a desert, a snake may be heard to slither or wind may sigh between rocks. Does silence in fact exist? Finding truly quiet places, in nature or the built environment is increasingly difficult. Even in our anechoic chamber, which was purpose built to be extremely quiet, located in the heart of our now very crowded and busy urban campus, we became aware of infrasound that penetrated, possibly from nearby construction equipment or from heavy traffic that was not nearly as common when the chamber was first built more than 30 years ago. Is anywhere that contains life actually silent?
Figure 1: In the top window, the waveform in blue indicates the amplitude over time each occasion that a pulse of sound was broadcast in the anechoic chamber, as shown in the spectrogram in the lower window, where the frequency is shown over the same time, and the color indicates the intensity of the sound (red being more intense than blue). Considerable very low frequency sound was evident and can be seen between the pulses in the waveform (which should be silent), and throughout at the bottom of the spectrogram. The blue dotted vertical lines show harmonics that were generated within the loudspeaker system. (Measurements shown in this study were by a Roland R26 recorder with Earthworks M23 measurement microphones with frequency response 9Hz to 23kHz ±1/-3dB)
As human populations increase, so do all forms of anthrophonic noise, often masking the sounds of nature. Does this noise cease at night, especially if well away from major cities and when humans are not close-by? This study analyzed the soundscape continuously recorded beside the southern white rhinoceros (Ceratotherium simum simum) enclosure at Fossil Rim Wildlife Center, about 75 miles southwest of Dallas Texas for a week during Fall 2013, to determine the quietest period each night and the acoustic environment in which these periods tended to occur. Rhinos hear infrasound, so the soundscape was measured from 0.1 Hz to 22,050 kHz. Since frequencies below 9 Hz still need to be confirmed however, these lowest frequencies were removed from this portion of the study.
Figure 2: Part of the white rhinoceros enclosure of Fossil Rim Wildlife Center, looking towards the tree line where the central recorder was placed
Figure 3: The sound pressure level throughout a relatively quiet day at the rhino enclosure. The loudest sounds were normally vehicles, machinery, equipment, aircraft, and crows. The 9pm weather front was a major contrast.
Figure 3 illustrates the rhythm of a day at Fossil Rim as shown by the sound level of a fairly typical 24 hours starting from midnight, apart from the evening storm. As often occurred, the quietest period was between midnight and the dawn chorus.
While there were times during the day when birds and insects were their most active and anthrophonic noise was not heard above them, it was discovered that all quiet periods contained anthrophonic noise, even at night. There was generally a low frequency, low amplitude hum – at times just steady and machine-like and not yet identified – and depending on wind direction, often short hums from traffic on a state highway over a mile away. Quiet periods ranged from a few minutes to almost an hour, usually eventually broken by anthrophonic sounds such as vehicles on a nearby county road, high aircraft, or dogs barking on neighboring ranches. However there was also a strong and informative biophonic presence – from insects to nocturnal birds and wildlife such as coyotes, to sounds made by the rhinos themselves and by other species at Fossil Rim. Geophonic intrusions were generally wind, thunder or rain, possibly hail.
The quietest quarter hour was about 4am on the Friday depicted in figure 3, but even then the absolute sound pressure level averaged 44.7 decibels, about the level of a quiet home or library. The wind was from the south southeast around 10 to 14 mph during this time. Audio clip 1 is the sound of this quiet period.
Figure 4: The quietest quarter hour recorded at Fossil Rim appears between the vertical red selection lines, with an average absolute sound pressure level of 44.5 decibels. The fairly constant waveform shown in blue in the top graph and the low frequency noise at the bottom of the spectrogram seemed to comprise the machine-like hum, the distant traffic hum which varies over time, and insects. The blue flashes between 3 and 5 Hz were mainly bird calls.
By contrast, the loudest of the “quietest nightly periods” was less than six minutes long, around 5am on Wednesday 23rd October, as shown between the vertical red lines in figure 5. Despite being the quietest period that night, it averaged a sound pressure level of 55.5 decibels, which is roughly the equivalent of a spoken conversation.
Figure 5: The loudest “quietest period each night” reveals broadband machine noise (possibly road work equipment somewhere in the district?) which continued for some hours and appears as the blue flecks across all frequencies. The horizontal blue line at 16.5 kHz is characteristic of bats. All species identification is being left to biologists for confirmation. Audio clip 2 is this selection.
Either side of the “quiet” minutes were short bursts of low frequency but intense truck and/or other machine noise indicated in red, some of which partially covered a clang when a rhino hit its fence with its horn, and distant barks, howls, moos and other vocalizations. The noise may have masked the extremely low frequency hums and insects that had been apparent on other nights or to have caused the insects to cease their activity. The strata below 2.5 kHz appear more ragged, indicating they are not being produced in such a uniform way as on quieter nights, and they are partially covered by the blue flecks of machine noise. However the strata at 5.5, 8.5, 11 and especially at 16.5 kHz that appeared on other nights are still evident. They appear to be birds, insects and bats. Audio clip 3 contains the sounds that broke this quiet period.
At no point during the entire week was anything closely approaching “silence” apparent. Krause reports that healthy natural soundscapes comprise a myriad of biophony, and indeed the ecological health of a region can be measured by its diverse voices (Krause 1987). However if these voices are too frequently masked or deterred by anthrophonic noise, animals may be altered behaviorally and physiologically (Pater et al, 2009), as the World Health Organization reports to be the case with humans who are exposed to chronic noise (WHO 1999). Despite some level of anthrophonic noise at most times, Fossil Rim seems to provide a healthy acoustic baseline since so many endangered species proliferate there.
Understanding soundscapes and later investigating any acoustic parameters that may correlate with animals’ behavior and/or physiological responses may lead us to think anew about the environments in which we hold animals captive in conservation, agricultural and even domestic environments, and about wildlife in parts of the world that are being increasingly encroached upon by man.
References: Krause, B. 1987. The niche hypothesis. Whole Earth Review . Wild Sanctuary. ———. 1987. Bio-acoustics: Habitat ambience & ecological balance. Whole Earth Review. Wild Sanctuary. McKenna, Megan F., et al. “Patterns in bioacoustic activity observed in US National Parks.” The Journal of the Acoustical Society of America 134.5 (2013): 4175-4175. Pater, L. L., T. G. Grubb, and D. K. Delaney. 2009. Recommendations for improved assessment of noise impacts on wildlife. The Journal of Wildlife Management 73:788-795. Wilson, E. O. 1984. Biophilia. Harvard University Press. World Health Organization. “Guidelines for community noise”. WHO Expert Taskforce Meeting. London. 1999.
Irene van Kamp, (irene.van.kamp@rivm.nl) Elise van Kempen, Hanneke Kruize, Wim Swart National Institute for Public Health and the Environment Netherlands Pobox 1 Postvak 10 3720 BA BILTHOVEN Netherlands Phone +31629555704
Popular version of paper in session 2aNSa, “Soundscapes and human restoration in green urban areas” Presented Tuesday morning, May 19, 2015, 9:35 AM, Commonwealth 1 169th ASA Meeting, Pittsburgh
Worldwide there is a revival of interest in the positive effect of landscapes, green and blue space, open countryside on human well-being, quality of life, and health especially for urban dwellers. However, most studies do not account for the influence of the acoustic environment in these spaces both in a negative and positive way. One of the few studies in the field, which was done by Kang and Zhang (2010) identified relaxation, communication, dynamics and spatiality as the key factors in the evaluation of urban soundscapes. Remarkable is their finding that the general public and urban designers clearly value public space very different. The latter had a much stronger preference for natural sounds and green spaces than the lay-observers. Do we as professionals tend to exaggerate the value of green and what characteristics of urban green space are key to health, wellbeing and restoration? And what role does the acoustic quality and accompanying social quality play in this? In his famous studies on livable streets Donald Appleyard concluded that in heavy traffic streets the number of contacts with friends, acquaintances and the amount of social interaction in general was much lower. Also people in busy streets had a tendency to describe their environment as being much smaller than their counterparts in quiet streets did. In other words, the acoustic quality affects not only our wellbeing and behavior but also our sense of territory, social cohesion and social interactions. And this concerns all of us: citing Appleyard “nearly everyone in the world lives in a street”.
There is evidence that green or natural areas/wilderness/ or urban environments with natural elements as well as areas with a high sound quality can intrinsically provide restoration through spending time there. Also merely the knowledge that such quiet and green places are available seems to work as a buffer effect between stress and health (Van Kamp, Klaeboe, Brown, and Lercher, 2015 : in Jian Kang and Brigitte Schulte-Fortkamp (Eds) in press).
Recently a European study was performed into the health effect of access and use of green area in four European cities of varying size in Spain, the UK, Netherlands and Lithuania)
At the four study centers people were selected from neighborhoods with varying levels of socioeconomic status and green and blue space. By means of a structured interview information was gathered about availability, use and importance of green space in the immediate environment as well as the sound quality of favorite green areas used for physical activity, social encounters and relaxation. Data are also available about perceived mental/physical health and medication use. This allowed for analyzing the association between indicators of green, restoration and health, while accounting for perceived soundscapes in more detail. In general there are four mechanisms assumed that lead from green and tranquil space to health: via physical activity, via social interactions and relaxation and finally via reduced levels of traffic related air and noise pollution. This paper will explore the role of sound in the process which leads from access and use of green space to restoration and health. So far this aspect has been understudied. There is some indication that certain areas contribute to restoration more than others. Most studies address the restorative effects of natural recreational areas outside the urban environment. The question is whether natural areas within, and in the vicinity of, urban areas contribute to psycho-physiological and mental restoration after stress as well. Does restoration require the absence of urban noise?
Example of an acoustic environment – a New York City Park – with potential restorative outcomes (Photo: A.L. Brown)