2aSC3 – Studying Vocal Fold Non-Stationary Behavior during Connected Speech Using High-Speed Videoendoscopy

Maryam Naghibolhosseini – naghib@msu.edu
Dimitar D. Deliyski – ddd@msu.edu
Department of Communicative Sciences and Disorders, Michigan State University
1026 Red Cedar Rd.
East Lansing, MI 48824

Stephanie R.C. Zacharias – Zacharias.Stephanie@mayo.edu
Department of Otolaryngology Head & Neck Surgery, Mayo Clinic
13400 E Shea Blvd.
Scottsdale, AZ 85259

Alessandro de Alarcon – alessandro.dealarcon@cchmc.org
Division of Pediatric Otolaryngology, Cincinnati Children’s Hospital Medical Center
3333 Burnet Ave
Cincinnati, OH 45229

Robert F. Orlikoff – orlikoffr16@ecu.edu
College of Allied Health Sciences, East Carolina University
2150 West 5th St.
Greenville, NC 27834

Popular version of paper 2aSC3
Presented Tuesday morning, Nov 6, 2018
176th ASA Meeting, Victoria, BC, Canada

You would feel the vibrations of your vocal folds when you place your hand on your neck while saying /a/. The vocal fold vibratory behavior can be studied to learn about the voice production mechanisms. Better understanding of the voice production in norm and disorder could be helpful to improve voice assessment and treatment strategies. One of the techniques to study the vocal fold function is laryngeal imaging. The most sophisticated tool for laryngeal imaging is high-speed videoendoscopy (HSV), which enables us to record vocal fold vibrations with high temporal resolution (thousands of frames per second, fps). The recent advancement of coupling HSV systems with flexible nasolaryngoscopes has provided us the unique opportunity of recording the vocal fold vibrations during connected speech for the first time.

In this study, HSV data were obtained from a vocally normal 38 year old female during reading of the “Rainbow Passage” using a custom-built HSV system at 4,000 fps. This frame rate leads to the recording length of 29.14 seconds (total of 116,543 frames). The following video shows one second of the recorded HSV with playback speed of 30 fps.

 Video1

The HSV dataset is large and it will take about 32 hours to just look at the data if you spend 1 second per image frame! You can imagine with this large dataset, the manual analysis of the data is not doable and automated computerized methods are required. The goal of this research project is to develop automatic algorithms for the analysis of HSV in running speech to extract meaningful information about the vocal fold function. How the vibration of the vocal folds starts and how it ends during phonation are critical factors in studying the pathophysiology of voice disorders. Hence, in this project, the onset and offset of phonation that have non-stationary behavior are studied.

We have developed the following automated algorithms: temporal segmentation, motion compensation, spatial segmentation, and onset/offset measurements. The temporal segmentation algorithm was able to determine the onset and offset timestamps of phonation. To do so, the glottal area (the dark area between the vocal folds) waveform was measured. The area change is due to the vibrations of the vocal folds. This waveform can be converted to an acoustic signal that we can listen to. In the following video, you can follow the “Rainbow Passage” text while listening to the extracted audio from the glottal area waveform. It should be noted that this audio signal was merely extracted from the HSV images and no acoustic signal was recorded from the subject.

Video 2

A motion compensation algorithm was developed to align the vocal folds across frames to overcome the laryngeal tissue maneuvers during connected speech. You may see in the following video that after the motion compensation, the vocal folds location is almost the same across frames in the cropped frame.

Video 3

The spatial segmentation was performed to extract the edges of the vibrating vocal folds from HSV kymograms. The kymograms were extracted by passing a line in the medial section of the frames to capture the vocal fold vibrations over this line in time. An active contour modeling approach was applied to the HSV kymograms of each vocalized segment to provide an analytic description of the vocal fold edges across the frames. You can see the result of spatial segmentation for one vocalization in the following figure.

videoendoscopy

Figure 1

The glottal attack time (the time difference between the first vocal fold oscillation to first contact), offset time (the time difference between the last vocal fold contact to last oscillation), amplification ratio, and damping ratio were measured from the spatially segmented kymogram, shown in the figure. The amplification ratio shows how the oscillation grows at the beginning of phonation and the damping ratio quantifies how the oscillation dies at the offset of phonation. These measures are beneficial to describe the laryngeal dynamics of voice production.


2aBAb2 – Feasibility of using ultrasound with microbubbles to purify cell lines for immunotherapy application

Thomas Matula – matula@uw.edu
Univ. of Washington
1013 NE 40th St.
Seattle, WA 98105

Oleg A. Sapozhnikov
Ctr. for Industrial and Medical Ultrasound
Appl. Phys. Lab
Univ. of Washington
Seattle, Washington
Phys. Faculty

Lev Ostrovsky
Dept. of Appl. Mathematics
University of Colorado
Inst. of Appl. Phys.
Russian Acad. of Sci.
Boulder, CO

Andrew Brayman
John Kucewicz
Brian MacConaghy
Dino De Raad
Univ. of Washington
Seattle, WA

Popular version of paper 2aBAb2
Presented Tuesday morning, Nov 6, 2018
176th ASA Meeting, Victoria, BC, Canada

Cells are isolated and sorted for a variety of diagnostic (e.g., blood tests) and therapeutic (e.g., stem cells, immunotherapy) applications, as well as for general research. The workhorses in most research and commercial labs are fluorescently-activated cell sorters (FACS) [1] and magnetically-labeled cell sorters (MACS) [2]. These tools use biochemical labeling to identify and/or sort cells which express specific surface markers (usually proteins). FACS uses fluorophores that target specific cell markers. The detection of a specific fluorescence wavelength tells the system to sort those cells. FACS is powerful and can sort based on several different cellular markers. However, FACS is also very expensive and complicated such that they are mostly found only in large core facilities.

MACS uses magnetic beads that attach to cell markers. Permanent magnets can then be used to separate magnetically-tagged cells from untagged cells. MACS is much less expensive than FACS, and can be found in most labs. However, MACS also suffers from weaknesses, such as low throughput, and can only sort based on a single marker.

We describe a new method that merges biochemical labeling with ultrasound-based separation. Instead of lasers and fluorophore tags (i.e., FACS), or magnets and magnetic particle tags (i.e., MACS), our technique uses ultrasound and microbubble tags (Fig. 1). Like FACS and MACS, we attach a biochemical label (an antibody) to attach a microbubble to the cell’s surface protein. We then employ an ultrasound pulse that generates an acoustic radiation force, pushing the microbubbles; the attached cells are dragged along with the microbubbles, effectively separating them from untagged cells. This is accomplished because cells only very lightly interact with ultrasound, whereas microbubbles interact very significantly with the sound waves. We theorized that the force acts on the microbubble while the cell acts as a fluid that adds a viscous drag to the system (see [3]).

immunotherapy

Figure 1. Cell separation technologies

We can break down our studies into two categories, cell rotation and cell sorting. In both cases we constructed an apparatus to view cells under a microscope. Figure 2 shows a cell rotating as the attached microbubbles align with the sound field (the movie can be found by clicking here). We developed a theory to describe this rotation, and the theory fits the data well, allowing us to ‘measure’ the acoustic radiation force on the conjugate microbubble-cell system (Fig. 3).

Figure 2. A leukemia cell has two attached microbubbles. An ultrasound pulse from above causes the cell to rotate.

Figure 3. We assume that the microbubbles act as point forces. The projection of these forces perpendicular to the radiation force direction leads to a torque on the cell, which is balanced by the viscous torque. This leads to an equation of motion that can be put in terms of angular displacement. Thus, the parameters are detailed in [3]. The results are plotted along with the data, showing a nice match between the theory and data. For our conditions, the acoustic radiation force was found to be F=1.7×10⁻¹²N. [IMAGE MISSING]

When placed in a flow stream with other cells, the tagged cells can be easily pushed with ultrasound. Figure 4a shows how a single leukemia cell is pushed downward while normal erythrocytes (red blood cells) continue flowing in the stream (the movie can be found by clicking here). This shows that one can effectively separate tagged cells. However, in a commercial setting, one wants to sort with a much higher concentration of cells. Figure 4b illustrates that this can be accomplished with our simple setup (the movie can be found by clicking here).

To summarize, we show preliminary data that supports the notion of developing an ultrasound-based cell sorter that has the potential for high throughput sorting at a fraction of the cost of FACS.

(a) [IMAGE MISSING] (b) [IMAGE MISSING]

Figure 4. (a) A single leukemia cell is pushed downward by an acoustic force while red blood cells continue to flow horizontally. It should be possible to detect rare cells using this technique. (b) For high-throughput commercial sorting, a much larger concentration of cells must be evaluated. Here, a large concentration of red blood cells, along with a few leukemia cells are analyzed. The ultrasound pushes the tagged leukemia cells downward. We used blue for horizontal flow (red blood cells) and red for ultrasound-based forcing downward.

[1] M. H. Julius, T. Masuda, and L. A. Herzenberg, “Demonstration That Antigen-Binding Cells Are Precursors of Antibody-Producing Cells after Purification with a Fluorescence-Activated Cell Sorter,” P Natl Acad Sci USA 69, 1934-1938 (1972).

[2] S. Miltenyi, W. Muller, W. Weichel, and A. Radbruch, “High-Gradient Magnetic Cell-Separation with Macs,” Cytometry 11, 231-238 (1990).

[3] T.J. Matula, et al, “Ultrasound-based cell sorting with microbubbles: A feasibility study,” J. Acoust. Soc. Am. 144, 41-52 (2018).

Controlled source level measurements of whale watch boats and other small vessels

Jennifer L. Wladichuk – jennifer.wladichuk@jasco.com
David E. Hannay, Zizheng Li, Alexander O. MacGillivray
JASCO Appl. Sci., 2305 – 4464 Markham St.
Victoria, BC V8Z 7X8, Canada

Sheila Thornton
Sci. Branch
Fisheries and Oceans Canada
Vancouver, BC, Canada

Popular version of paper 2pUWb8
Presented Tuesday afternoon, Nov 6, 2018
176th ASA Meeting, Victoria, BC, Canada

The Vancouver Fraser Port Authority’s Enhancing Cetacean Habitat and Observation (ECHO) program sponsored deployment of two autonomous marine acoustic recorders (AMAR) in Haro Strait (BC), from July to October 2017, to measure sound levels produced by large merchant vessels transiting the strait. Fisheries and Oceans Canada (DFO), a partner in ECHO, supported an additional study using these same recorders to systematically measure underwater noise emissions (0.01–64 kHz) of whale watch boats and other small vessels that operate near Southern Resident Killer Whales (SRKW) summer feeding habitat. During this period, 20 different small vessels were measured operating at a range of speeds (nominally 5 knots, 9 knots, and cruising speed). The measured vessels were catagorized into six different types based primarily on hull shape: ridged-hull inflatable boats (RHIBs), monohulls, catamarans, sail boats, landing craft, and one small boat (9.9 horsepower outboard). Acoustic data were analyzed using JASCO’s PortListen® software system, which automatically calculates source levels from calibrated hydrophone data and vessel position logs, according to the ANSI S12.64-2009 standard for ship noise measurements. To examine potential behavioural effects on SRKW, vessel noise emissions were analyzed in two frequency bands (0.5–15 kHz and >15 kHz) corresponding to the whales’ communication and echolocation ranges, respectively (Heise et al. 2015). We found that generally, with increased speed, decibel levels increased across the different vessel types, particularly in the echolocation band (Table 1). However, the speed trends were not as strong as those of large merchant vessels. Of the vessels measured, monohulls commonly had the lowest source levels in both SRKW frequency bands, while catamarans had the highest source levels in the communication band and the landing craft had the highest levels in the echolocation band at all speeds (Figure 1). Another key finding was the amount of noise onboard echosounders produced; a significant peak at approximately 50 kHz was present in some vessels, which is within the most sensitive hearing range of SRKW.

vessels

Table 1. Average source level for each vessel type in the SRKW communication and echolocation frequency bands for slow, medium, and fast vessel speeds.

vessels

Figure 1. Average one-third octave band source levels for each vessel type for the slow speed passes (≤7 kn, ie. whale-watching speed). Due to non-vessel related noise at frequencies below approximately 200 Hz (grey vertical line), levels at those low frequencies cannot be associated with vessel source levels. The peak observed at around 50 kHz is from onboard echosounders.

Literature cited:
Heise, K.A., L. Barret-Lennard, N.R. Chapman, D.T. Dakin, C. Erbe, D. Hannay, N.D. Merchant, J. Pilkington, S. Thornton, et al. 2017. Proposed metrics for the management of underwater noise for southern resident killer whales. Coastal Ocean Report Series. Volume 2, Vancouver, Canada. 30 pp.

5aSC3 – Children’s perception of their own speech; A perceptual study of Polish /s, ʂ, ɕ/

Marzena Żygis – zygis@leibniz-zas.de
Leibniz Centre – General Linguistics & Humboldt University, Berlin, Germany
Marek Jaskuła – Marek.Jaskula@zut.edu.pl
Westpomeranian University of Technology, Szczecin, Poland

Laura L. Koenig – koenig@haskins.yale.edu
Adelphi University, Garden City, New York, United States; Haskins Laboratories; New Haven CT;

Popular version of paper 5aSC3, “Do children understand adults better or themselves? A perceptual study of Polish /s, ʂ, ɕ/”
Presented Friday morning, November 9, 2018, 8:30–11:30 AM, Upper Pavilion

Typically-developing children usually pronounce most sounds of their native language correctly by about 5 years of age, but for some “difficult” sounds the learning process may take longer.  One set of difficult sounds is called the sibilants, an example of which is /s/.  Polish has a complex three-way sibilant contrast (see Figure 1).  One purpose of this study was to explore acquisitional patterns of this unusual sibilant set.

Further, most past studies assessed children’s accuracy in listening to adult speech.  Here, we explored children’s perception of their own voices as well as that of an adult. It might be that children’s speech contain cues that adults do not notice, i.e. that they can hear distinctions in their own speech that adults do not.

We collected data from 75 monolingual Polish-speaking children, ages 35–95 months. The experiment had three parts. First, children named pictures displayed on a computer screen. Words only differed in the sibilant consonant, holding all other sounds constant (see Figure 1).

Figure 1:  Word examples and attached audio (left, adult; right, child)

Next, children listened to the words produced by an unknown adult and chose the picture corresponding to what they heard. Finally, they listened to their own productions, as recorded in the first part, and chose the corresponding picture.  Our computer setup, “Linguistino”, allowed us to obtain the children’s response times via button-press, and also provided for recording their words in part 1 and playing them back, in randomized order, in part 3.

The results show three things. First, not surprisingly, children’s labeling is both more accurate and faster as they get older. The accuracy data, averaged over sounds, are shown in Figure 2.

Figure 2:  Labeling accuracy

Further, some sibilants are harder to discriminate than others.  Figure 3 shows that, across ages, children are fastest for the sound /ɕ/, and slowest for /ʂ/, for both adult and child productions. (The reaction times for /ʂ/ and /s/ were not significantly different, however).

Figure 2: Reaction time of choosing the sibilant /ɕ/, /s/ or /ʂ/ in function of age.

Finally, and not as expected, children’s labeling is significantly worse when they label their own productions vs. those of the adult. One might think that children have considerable experience listening to themselves, so that they would most accurately label their own speech, but this is not what we find.

These results lend insight into the specifics of acquiring Polish as a native language, and may also contribute to an understanding of sibilant perception more broadly. They also suggest that children’s internal representations of these speech sounds are not built around their own speech patterns.

1aBA5 – AI and the future of pneumonia diagnosis

Xinliang Zheng – lzheng@intven.com
Sourabh Kulhare – skulhare@intven.com
Courosh Mehanian — cmehanian@intven.com
Ben Wilson — bwilson@intven.com
Intellectual Ventures Laboratory
14360 SE Eastgate Way
Bellevue, WA 98007, U.S.A.

Zhijie Chen – chenzhijie@mindray.com
SHENZHEN MINDRAY BIO-MEDICAL ELECTRONICS CO., LTD.
Mindray Building, Keji 12th Road South,High-tech Industrial Park,
Nanshan, Shenzhen 518057, P.R. China

Popular version of paper 1aBA5
Presented Monday morning, November 5, 2018
176th ASA Meeting, Minneapolis, MN

A key gap for underserved communities around the world is the lack of clinical laboratories and specialists to analyze samples. But thanks to advances in machine learning, a new generation of ‘smart’ point-of-care diagnostics are filling this gap and, in some cases, even surpassing the effectiveness of specialists at a lower cost.

Take the case of pneumonia. Left untreated, pneumonia can be fatal. The leading cause of death among children under the age of five, pneumonia claims the lives of approximately 2,500 a day – nearly all of them in low-income nations.

To understand why, consider the differences in how the disease is diagnosed in different parts of the world. When a doctor in the U.S. suspects a patient has pneumonia, the patient is usually referred to a highly-trained radiologist, who takes a chest X-ray using an expensive machine to confirm the diagnosis.

Because X-ray machines and radiologists are in short supply across much of sub-Saharan Africa and Asia and the tests themselves are expensive, X-ray diagnosis is simply not an option for the bottom billion. In those settings, if a child shows pneumonia symptoms, a cough and a fever, she is usually treated with antibiotics as a precautionary measure and sent on her way. If, in fact, the child does not have pneumonia, this means she receives unnecessary antibiotics, leaving her untreated for her real illness and putting her health at risk. The widespread overuse of antibiotics also contributes to the buildup in resistance of the so-called “superbug” – a global threat.

In this context, an interdisciplinary team of algorithm developers, software engineers and global health experts at Intellectual Ventures’ Global Good—a Bill and Melinda Gates-backed technology fund that invents for humanitarian impact—considered the possibility of developing a low-cost tool capable of automating pneumonia diagnosis.

The team turned to ultrasound – an affordable, safe, and widely-available technology that can be used to diagnose pneumonia with a comparable level of accuracy to X-ray.

It wouldn’t be easy. To succeed, the device would need to be cost-effective, portable, easy-to-use and able to do the job quickly, accurately and automatically in challenging environments.

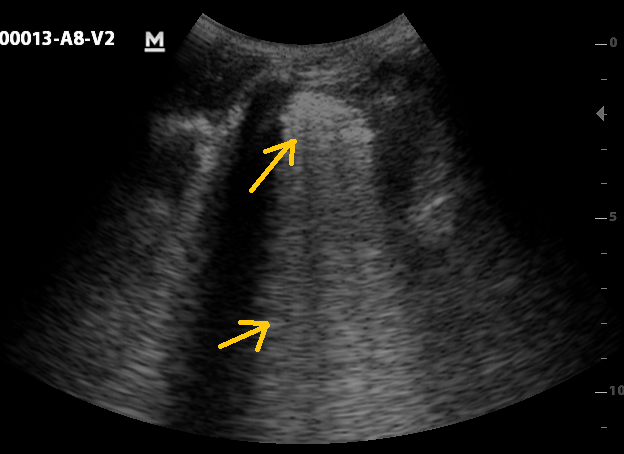
Global Good started by building an algorithm to recognize four key features associated with lung conditions in an ultrasound image – pleural line, B-line, consolidation and pleural effusion. This called for convolutional neural networks (CNNs)—a machine learning method well-suited for image classification tasks. The team trained the algorithm by showing it ultrasound images collected from over 70 pediatric and adult patients. The features were annotated on the images by expert sonographers to ensure accuracy.

Figure 1: Pleural line (upper arrow) and a-lines (lower arrow), indication of normal lung

pneumonia

Figure 2: Consolidation (upper arrow) and merged B-line (lower arrow), indication of abnormal lung fluid and potentially pneumonia

Early tests show that the algorithm can successfully recognize abnormal lung features in ultrasound images and those features can be used to diagnose pneumonia as reliably as X-ray imaging—a highly encouraging outcome.

The algorithm will eventually be installed on an ultrasound device and used by minimally-trained healthcare workers to make high-quality diagnosis accessible to children worldwide at the point of care. Global Good hopes that the device will eventually bring benefits to patients in wealthy markets as well, in the form of a lower-cost, higher quality and faster alternative to X-ray.