1aBAb12 – Novel use of a lung ultrasound sensor for monitoring lung conditions

Novel use of a lung ultrasound sensor for monitoring lung conditions

Tanya Khokhlova – tdk7@uw.edu
Adam Maxwell – amax38@uw.edu
Gilles Thomas – gthom@uw.edu
Jeff Thiel – jt43@uw.edu
Alex Peek – apeek@uw.edu
Bryan Cunitz – bwc@uw.edu
Michael Bailey – mbailey@uw.edu
Kyle Steinbock – kyles96@uw.edu
Layla Anderson – anderla@uw.edu
Ross Kessler – kesslerr@uw.edu
Adeyinka Adedipe- adeyinka@uw.edu
University of Washington
Seattle, WA, 98195

Popular version of paper ‘1aBAb12 – Novel use of a lung ultrasound sensor for detection of lung interstitial syndrome

Presented Monday morning, November 29, 2021

181^st ASA Meeting

The need to continuously evaluate the amount of fluid in the lung is essential in patients suffering from a number of conditions, including viral pneumonia (including COVID-19) and heart failure, and patients on dialysis. Chest x-ray and CT are typically used for this purpose, but can not be done continuously due to the radiation dose, and have logistical limitations in some cases, for example when transporting unstable patients or patients with COVID-19 due to the risk of contagion. Lung ultrasound (LUS) is non-ionizing and safe, and has recently emerged as a useful triage and monitoring tool for quantification of lung water. Because lung is air-filled, it is reflective for ultrasound, and in LUS exams it is image artifacts that are being evaluated, rather than true lung images. The artifacts termed A-lines are periodic bright horizontal lines parallel to the lung surface representing multiple reflections of ultrasound pulse from the lung and indicating a normal aeration pattern. The artifacts termed B-lines are comet-like bright vertical regions originating at the lung surface and extending down. The number and distribution of B-lines are known to correlate with presence of fluid in the lung and the condition severity. However, visualization and quantification of B-lines requires training and is machine and operator dependent, whereas in select clinical scenarios continuous, automated hands-free monitoring of lung function is preferred, e.g. COVID19 infection.
In this study we were aiming to identify the detected ultrasound signal features that are associated with B-lines and to develop a miniature wearable non-imaging lung ultrasound sensor (LUSS). Individual adhesive LUSS elements could be attached to patients in specific anatomic locations similarly to EKG leads, and ultrasound signals would be collected and processed with automated algorithms continuously or on demand. First, we used an open platform ultrasound imaging system to perform standard 10-zone LUS in ten patients with confirmed pulmonary edema, and in five healthy volunteers. The ultrasound signal data corresponding to each image were collected for subsequent off-line Doppler, decorrelation and spectral analyses. The metrics we found to be associated with the B-line thickness and number were peaks of Doppler power at the pleural line and the ultrasound signal amplitude corresponding to a large depth.

Left: examples of lung ultrasound images containing A-lines and B-lines and the corresponding signals detected by the ultrasound imaging probe. Right: conceptual diagram of the use of LUSS for monitoring of lung condition and a prototype LUSS element. Adhesive LUSS elements are applied in 10 anatomic locations and automated signal processing software displays lung fluid score for each element on a 4-point scale: none (green), mild (yellow), moderate (orange) or severe (red).

Next, we built miniature LUSS elements powered by custom-built multiplexed transmit-receive circuit, and tested them in a benchtop lung model – polyurethane sponge containing variable volumes of water – side by side with LUS imaging probe previously used in patients. Wetting of the sponge produced B-lines on the ultrasound images, and the associated ultrasound signals were similar to those measured by LUSS elements. We hope to proceed with testing LUSS in human patients in the nearest future. This work was supported by NIH R01EB023910.

1aBAb9 – Extracting Human Skull Properties by Using Ultrasound and Artificial Intelligence

Extracting Human Skull Properties by Using Ultrasound and Artificial Intelligence

Churan He1– churanh2@illinois.edu
Yun Jing2 – jing.yun@psu.edu
Aiguo Han1 – han51@illinois.edu

1. Department of Electrical and Computer Engineering
The University of Illinois at Urbana Champaign
306 North Wright Street
Urbana, IL 61801

2. Graduate Program in Acoustics
Pennsylvania State University
201 Applied Science Building
University Park, PA 16802

Popular version of paper ‘1aBAb9 – Human skull profile and speed of sound estimation using pulse-echo ultrasound signals with deep learning

Presented Monday morning, November 29, 2021

181st Meeting of the Acoustical Society of America in Seattle, Washington.

Ultrasound is a tremendously valuable tool for medical imaging and therapy of the human body. When it comes to applications in the brain, however, the presence of the skull poses severe challenges to both imaging and therapy. The skulls of human adults induce significant distortions (also called phase aberrations) to the acoustic waves. The aberrations result in blurred brain images that are extremely challenging to interpret. The skull also distorts and shifts the acoustic focus, causing challenges in therapy of the brain (such as treating essential tremors and brain tumors) using high-intensity focused ultrasound.

Prior research has shown that phase aberrations can be most accurately corrected if the skull profile (i.e., thickness distribution) and speed of sound are known a priori. Various methods have been proposed to estimate the skull profile and speed of sound. The gold-standard method used in treatment planning derives the skull properties from computed-tomography (CT) images of the skull. The CT-based method, however, entails ionizing radiation, potentially causing harm to the patients.

We propose an ultrasound-based method to extract the skull properties. This method is safer because ultrasound does not cause ionizing radiation. We developed an artificial intelligence (AI) algorithm (specifically, a deep learning algorithm) that predicted the skull thickness and sound speed by using ultrasound echo signals reflected from the skull.

We tested the feasibility of our method through a simulation study (Figure 1). We performed acoustic simulations using realistic skull models built from CT scans of five ex vivo human skulls (see animation). The simulations generated a large number (=7891) of ultrasound signals from skull segments for which the thickness and sound speed were known. We used 80% of the data to train our AI algorithm and 20% for testing. We developed and tested two algorithm versions: One version took the original echo signal as the input and the other used a transformed signal (i.e., Fourier transform that displays the signal’s frequency spectrum).

Both versions of our AI algorithm achieved accurate results, while the version using the transformed signals appeared to be more accurate. Using the original signal as the input, we obtained a mean absolute error of 0.3 mm for skull thickness prediction and 31 m/s for sound speed prediction. When transformed signals were used, the error in thickness prediction was reduced to 0.2 mm (= 3% of the average skull thickness [6.3 mm]), and the error in sound speed prediction was reduced to 25 m/s (= 1% of the average sound speed [2340 m/s]). In the case of transformed signals, the correlation between predicted values and the ground truth was 0.98 for thickness and 0.81 for speed of sound (Figure 2), where a correlation value of 1 represents perfect correlation.

Collectively, our preliminary results demonstrate that the developed AI algorithm can accurately estimate skull thickness and speed of sound, providing a potentially powerful tool to correct skull phase aberration for transcranial ultrasound brain imaging and therapy.

[Animation: 3-dimensional density map of one of the skulls used in the study]

Figure 1. Schematic diagram of the simulation study


Figure 2. a) Scatter plot of extracted speed of sound versus ground truth; b) scatter plot of extracted thickness versus ground truth.


1aBAb2 – Transcranial Radiation of Guided Waves for Brain Ultrasound

Eetu Kohtanen – ekohtanen3@gatech.edu
Alper Erturk – alper.erturk@me.gatech.edu
Georgia Institute of Technology
771 Ferst Drive NW
Atlanta, GA 30332

Matteo Mazzotti – matteo.mazzotti@colorado.edu
Massimo Ruzzene – massimo.ruzzene@colorado.edu
University of Colorado Boulder
1111 Engineering Dr
Boulder, CO 80309

Popular version of paper ‘1aBAb2’
Presented Tuesday morning, June 8, 2021
180th ASA Meeting, Acoustics in Focus

Ultrasound imaging is a safe and familiar tool for producing medical images of soft tissues. Ultrasound can also be used to ablate tumors by focusing a large amount of acoustic energy (“focused ultrasound”) capable of destroying tumors.

The use of ultrasound in the imaging and treatment of soft tissues is well established, but ultrasound treatment for the brain poses important scientific challenges. Conventional medical ultrasound uses bulk acoustic waves that travel directly through the skull into the brain. While the center of the brain is relatively accessible in this way to treat disorders such as essential tremor, the need for transmitting waves to the brain periphery or the skull-brain interface efficiently (with reduced heating of the skull) motivates research on alternative methods.

The skull is an obstacle for bulk waves, but for guided waves it presents opportunity. Unlike bulk waves, guided (Lamb) waves propagate along structures (such as the skull), rather than through them—as the name suggests, their direction of travel is guided by structural boundaries.  If these guided waves are fast enough, they “leak” into the brain efficiently. However, there are challenges due to the complex skull geometry and bone porosity. Our research seeks a fundamental understanding of how guided waves in the skull radiate energy into the brain to pave the way for making guided waves a viable medical ultrasound tool to expand the treatment envelope.

To study the radiation of guided waves from skull bone, experiments were conducted with submersed skull segments. A transducer emits pressure waves that hit the outer side of the bone, and a hydrophone measures the pressure field on the inner side. In the following animation, the dominant guided wave radiation angle can be seen as 65 degrees. With further data processing, the experimental radiation angles (contours) are obtained with frequency. Additionally, a numerical model that considers the separate bone layers and the fluid loading is constructed to predict the radiation angles of a set of different guided wave types (solid branches). The experimental contours are always accompanied by corresponding numerical prediction, validating the model.

Experimental pressure field on the inner side of the skull bone segment and the corresponding radiation angles

With these results, we have a better understanding of guided wave radiation from the skull bone. The authors hope that these fundamental findings will eventually lead to application of guided waves for focused ultrasound in the brain.

3aBA9 – Ultrasound mediated thermal stress augments mass and drug transport in brain tumors

Costas Arvanitis
Georgia Institute of Technology
costas.arvanitis@gatech.edu

Popular version of paper 3aBA9 The role of U.S. thermal stress in modulating the vascular transport dynamics in the brain tumors
Presented Thursday morning, June 10, 2021
180th ASA Meeting, Acoustics in Focus

Local hyperthermia and stimuli-responsive delivery systems, such as thermosensitive liposomes, represent promising strategies to locally enhance drug delivery in brain tumors and improve treatment outcomes. However, a critical obstacle towards exploring their therapeutic potential in brain tumors is the limited ability to attain reliably and reproducibly the desired temperature in the brain.

Dr Costas Arvanitis at the Georgia Institute of Technology and Emory University, and his graduate student, Chulyong Kim, hypothesized that trans-skull focused ultrasound combined with closed-loop controlled methods can achieve this goal.

brain tumors
Figure 1. Graphical representation of  US mediated  thermal stress drug release and delivery from  thermosensitive drugs in brain tumors.

Almost!
Attaining controlled thermal stress through the skull is not a trivial problem, especially in mice where every new treatment is tested for safety and efficacy. For example, although at low frequencies (< 1 MHz) most of the energy is transmitted through the skull, the resulting large focal region overlaps substantially with the skull, which due to its higher absorption leads to disproportionally high skull heating. On the other hand, at higher frequencies (> 2 MHz) skull reflections and aberrations become significant, and thus limit our ability to focus the beam in the brain through the skull. Using a physically accurate mathematical modeling, the investigations revealed that an optimal frequency (≈ 1.7 MHz) does exist for applying localized thermal stress in mice brain without overheating the skull.

Based on this knowledge, the investigators built a closed-loop trans-skull magnetic resonance imaging guided focused ultrasound (MRgFUS) prototype and demonstrated that it can attain reproducible experimentation and heating of the entire tumor at the desired temperature. Next, using semi-quantitative imaging, they revealed that localized thermal stress (41.5 oC for 10 minutes) in brain tumors in rodents promotes acute changes in the cerebrovascular transport dynamics in the brain tumor microenvironment. These changes can be important, as they can increase the amount of drug that reaches the tumor.

Subsequently, by combining the abilities of this system with those of thermosensitive liposomes loaded with doxorubicin, the most common chemotherapeutic agent, they were able to achieve a marked improvement in doxorubicin accumulation and uptake in preclinical glioma tumor models. Crucially, survival studies indicated that the proposed two-pronged strategy could lead to substantial improvement in the survival.

Overall, this work, in addition to refining our understanding on the role of thermal stress in modulating the transport dynamics in the brain tumor microenvironment, allowed to establish a new paradigm for noninvasive targeted drug delivery in glioblastomas. It may, thus, create new opportunities towards attaining clinically effective drug delivery in patients with aggressive brain tumors, such as glioblastoma, that currently have limited treatment options.

Acknowledgments: This study was supported by the National Institutes of Health grants R00 EB016971.

Links: https://arvanitis.gatech.edu/

1aBAd2 – Pilot studies on zebrafish echocardiography and zebrafish ultrasound vibro-elastography

Xiaoming Zhang, PhD –Zhang.Xiaoming@mayo.edu
Department of Radiology
Mayo Clinic
Rochester, MN 55905

Alex X. Zhang, Xiaolei Xu, PhD
Department of Biochemistry and Molecular Biology
Mayo Clinic
Rochester, MN 55905

Popular version of paper 1aBAd2
Presented Monday morning, December 7, 2020
179th ASA Meeting, Acoustics Virtually Everywhere

Zebrafish are increasingly being used as animal models for human diseases such as cardiomyopathy and neuroblastoma.  Like humans, zebrafish have a near-fully sequenced genome. However, the body of a zebrafish is only about 1.5-2.5 cm in length, which is much smaller than a person. To extrapolate results from zebrafish to humans, reliable quantitative measures on zebrafish are needed.

In this pilot study, we develop two noninvasive measurement techniques in zebrafish. One is to measure the heart function of zebrafish using echocardiography. Another is to measure the elastic property of zebrafish tissues using ultrasound vibro-elastography.

In zebrafish echocardiography, an adult zebrafish was anesthetized for three minutes in a tricaine solution. The zebrafish was then taken out of the anesthetic solution and positioned in a specially designed holder. The high-frequency Vevo 3100 ultrasound system with a MX700 ultrasound probe (29-71 MHz) was used to measure the heart function of the zebrafish. Figure 1 shows the experimental setup. Ultrasound imaging was used to measure heart volumes at the end of systole and diastole. The ejection fraction of the heart was analyzed. Pulse-wave Doppler was also used to analyze the heart function. We developed a technique to improve zebrafish echocardiography by removing the surface skin tissue near the heart of a zebrafish, which significantly improved the resolution of ultrasound images for analyzing heart function in zebrafish. All zebrafish recovered from this procedure and the subsequent echocardiography exam.

Another pilot study was to measure the elastic properties of zebrafish using ultrasound vibro-elastography. A 0.1 second gentle harmonic vibration was generated on the tail of a zebrafish using a sphere tip indenter with a 3 mm diameter. Shear wave propagation in the zebrafish was measured using another ultrasound system with a high frequency 18 MHz ultrasound probe. High frame rate ultrasound images were obtained using this ultrasound system to measure the generated wave propagation (300-500 Hz) in the bodies of the zebrafish. Figure 2 shows the experimental setup. Video 1 shows the wave propagation in a zebrafish. A region of interested (ROI) was used to analyze the sheer wave speed map. The ROI covered the most central area of the zebrafish surrounding the heart. The wave speed was 3.13 ± 1.20 (m/s) in the ROI at 300 Hz. It was found that wave speed increased from 300 Hz to 500 Hz as it passed through the zebrafish. All zebrafish recovered from this experiment. We will improve this technique for measuring elastic properties of the heart of zebrafish. It is feasible to develop this technique for measuring the elastic properties of zebrafish for phenotyping various diseases.

zebrafish echocardiography
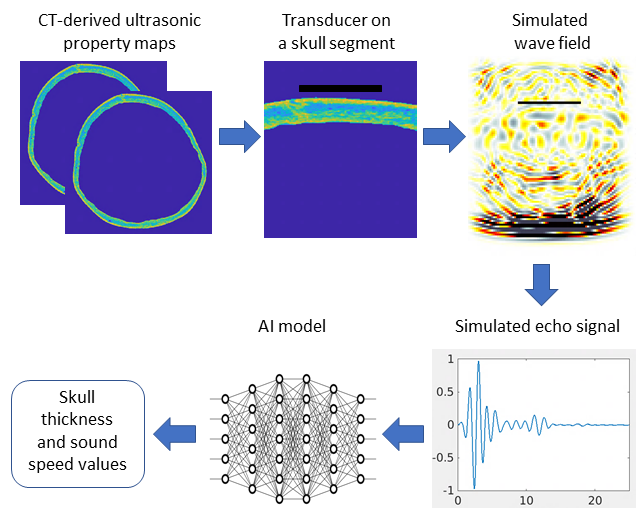
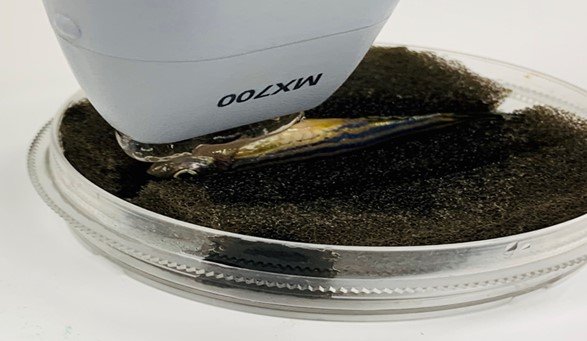
Figure 1. Experiment setup of zebrafish echocardiography.

zebrafish ultrasound vibro-elastographyFigure 2. Experimental setup of zebrafish ultrasound vibro-elastography.

2pBAc – Targeting Sound with Ultrasound in the Brain

Scott Schoen Jr – scottschoenjr@gatech.edu
Costas Arvanitis – costas.arvanitis@gatech.edu

Georgia Tech
901 Atlantic Dr
Atlanta, GA 30318

Popular version of 2pBAc – Spatial Characterization of High Intensity Focused Ultrasound Fields in the Brain
Presented Tuesday afternoon, December 8, 2020
179th ASA Meeting, Acoustics Virtually Everywhere

The pitch and size of a sound are quite intrinsically connected. This is why, for instance, low-register instruments (such as a tuba or double bass) are large, while higher pitched ones may be very small (like a piccolo or triangle). Sound travels in waves, and the product of the length of the wave (wavelength) and its pitch (frequency) is a constant (namely, the speed of sound).

Consequently, the wavelength of sounds we can hear may be between about 15 m and 0.2 cm. But just as there are wavelengths of light we cannot see (such as ultraviolet and X-rays), there exists sound with much smaller wavelengths. Ultrasound, so called since its frequency is above our hearing range, is able to travel through human tissue and enables noninvasive imaging with millimeter resolution.

Since sound is pressure, it also carries energy. And, much like sunlight through a magnifying glass, sound energy may be focused to a small area to cause heating. This technique has allowed noninvasive and minimally invasive therapy, where focused ultrasound (FUS) creates small regions of high heat or forces to burn or manipulate the tissue. This is especially important for brain diseases, where surgery is particularly challenging.

ultrasound
Fig. 1 – Human cells are sensitive to sound frequencies from about 20 Hz to 20 kHz (left). However, focusing sound to a small area requires small wavelengths—and thus much higher frequencies (right). Not to Scale

Interestingly, it turns out that at very high pressures, so-called nonlinear acoustic effects become important, and the sound begins to interact with itself. One consequence is that if the FUS has to very high frequencies, say 995 kHz and 1005 kHz, the focal spot will a few millimeters, similar to 1 mm. However, the high pressure interaction will also generate energy at 1005 kHz – 995 kHz = 10 kHz—within the audible and tactile range.

This work describes our use of simulations and experiments to understand how this low frequency energy might be realized for FUS through the skull. Understanding the strength and distribution of low frequency energy generated with high frequency FUS may open a new range of therapeutic and diagnostic capabilities in one of the most complex and medically imperative organs: the brain.