3aUWa6 – Inversion of geo-acoustic parameters from sound attenuation measurements in the presence of swim bladder bearing

Orest Diachok – orest.diachok@jhuapl.edu
Johns Hopkins University Applied Physics Laboratory
11100 Johns Hopkins Rd.
Laurel MD 20723

Altan Turgut – turgut@wave.nrl.navy.mil
Naval Research Laboratory
4555 Overlook Ave. SW
Washington DC 20375

Popular version of paper 3aUWa6 “Inversion of geo-acoustic parameters from transmission loss measurements in the presence of swim bladder bearing fish in the Santa Barbara Channel”
Presented Wednesday morning, December 6, 2017, 9:15-10:00 AM, Salon E
174th ASA Meeting, New Orleans

The intensity of sound propagating from a source in the ocean becomes diminished with range due to geometrical spreading, chemical absorption, and reflection losses from the bottom and surface. Measurements of sound intensity vs. range and depth in the water column may be used to infer the speed of sound, density and attenuation coefficient (geo-alpha) of bottom sediments. Numerous inversion algorithms have been developed to search through physically viable permutations of these parameters and identify the values of these parameters that provide the best fit to measurements. This approach yields valid results in regions where the concentration of swim bladder bearing fish is negligible.

In regions where the there are large numbers of swim bladder bearing fish, the effect of attenuation due to fish (bio-alpha) needs to be considered to permit unbiased estimates of geo-acoustic parameters (Diachok and Wales, 2005; Diachok and Wadsworth, 2014).

Swim bladder bearing fish resonate at frequencies controlled by the dimensions of their swim bladders. Adult 16 cm long sardines resonate at 1.1 kHz at 12 m depth. Juvenile sardines, being smaller, resonate at higher frequencies. If the number of fish is sufficiently large, sound will be highly attenuated at the resonance frequencies of their swim bladders.

To demonstrate the competing effects of bio and geo-alpha on sound attenuation we conducted an interdisciplinary experiment in the Santa Barbara Channel during a month when the concentration of sardines was known to be relatively high. This experiment included an acoustic source, S, which permitted measurements at frequencies between 0.3 and 5 kHz and an array of 16 hydrophones, H, which was deployed 3.7 km from the source, as illustrated in Figure 1. Sound propagating from S to H was attenuated by sediments at the bottom of the ocean (yellow) and a layer of fish at about 12 m depth (blue). To validate inferred geo-acoustic values from the sound intensity vs. depth data, we sampled the bottom with cores and measured sound speed and geo-alpha vs. depth with a near-bottom towed chirp sonar (Turgut et al., 2002). To validate inferred bio-acoustic values, Carla Scalabrin of Ifremer, France measured fish layer depths with an echo sounder, and Paul Smith of the Southwest Fisheries Science Center conducted trawls, which provided length distributions of dominant species. The latter permitted calculation of swim bladder dimensions and resonance frequencies.

Figure 1. Experimental geometry: source, S deployed 9 m below the surface between a float and an anchor, and a vertical array of hydrophones, H, deployed 3.7 km from source.

Figure 2 provides two-hour averaged measurements of excess attenuation coefficients (corrected for geometrical spreading and chemical absorption) vs. frequency and depth at night, when these species are generally dispersed (far apart from each other) near the surface. The absorption bands centered at 1.1, 2.2 and 3.5 kHz corresponded to 16 cm sardines, 10 cm anchovies, and juvenile sardines or anchovies at 12 m respectively. During daytime, sardines generally form schools at greater depths, where they resonate at “bubble cloud” frequencies, which are lower than the resonance frequencies of individuals.

Swim bladder

Figure 2. Concurrent echo sounder measurements of energy reflected from fish vs. depth (left), and excess attenuation vs. frequency and depth at night (right).

The method of concurrent inversion (Diachok and Wales, 2005) was applied to measurements of sound intensity vs. depth to estimate values of bio-and geo-acoustic parameters. The geo-acoustic search space consisted of the sound speed at the top of the sediments, the gradient in sound speed and geo-alpha. The biological search space consisted of the depth and thickness of the fish layer and bio-alpha within the layer. Figure 3 shows the results of the search for the values of geo-alpha that resulted in the best fit between calculations and measurements, 0.1 dB/m at 1.1 kHz and 0.5 dB/m at 1.9 kHz. Also shown are results of chirp sonar estimates of geo-alpha at 3.2 kHz and quadratic fit to the data.

Figure 3. Attenuation coefficient in sediments derived from concurrent inversion of bio and geo parameters, geo only, chirp sonar, and quadratic fit to data.

If we had assumed that bio-alpha was zero, then the inverted value of geo-alpha would have been 0.12 dB/m at 1.1 kHz, which is about ten times greater than the properly derived estimate, and 0.9 dB/m at 1.9 kHz.

These measurements were made at a biological hot spot, which was identified through an echo sounder survey. None of the previously reported experiments, which were designed to permit inversion of geo-acoustic parameters from sound propagation measurements, included echo sounder measurements of fish depth or trawls. Consequently, some of these measurements may have been conducted at sites where the concentration of swim bladder bearing fish may have been significant, and inverted values of geo-acoustic parameters may have been biased by neglect of bio-alpha.

Acknowledgement: This research was supported by the Office of Naval Research Ocean Acoustics Program.

References

Diachok, O. and S. Wales (2005), “Concurrent inversion of bio and geo-acoustic parameters from transmission loss measurements in the Yellow Sea”, J. Acoust. Soc. Am., 117, 1965-1976.

Diachok, O. and G. Wadsworth (2014), “Concurrent inversion of bio and geo-acoustic parameters from broadband transmission loss measurements in the Santa Barbara Channel”, J. Acoust. Soc. Am., 135, 2175.

Turgut, A., M. McCord, J. Newcomb and R. Fisher (2002) “Chirp sonar sediment characterization at the northern Gulf of Mexico Littoral Acoustic Demonstration Center experimental site”, Proceedings, Oce

3aPA7 – Moving and sorting living cells with sound and light

Gabriel Dumy– gabriel.dumy@espci.fr
Mauricio Hoyos – mauricio.hoyos@espci.fr
Jean-Luc Aider – jean-luc.aider@espci.fr
ESPCI Paris – PMMH Lab
10 rue Vauquelin
Paris, 75005, FRANCE

Popular version of paper 3aPA7, “Investigation on a novel photoacoustofluidic effect”

Presented Wednesday morning, December 6, 2017, 11:00-11:15 AM, Balcony L

174th ASA Meeting, New Orleans

Amongst the various ways of manipulating suspensions, acoustic levitation is one of the most practical yet not very known to the public. Allowing for contactless concentration of microscopic bodies (from particles to living cells) in fluids (whether it be air, water, blood…), this technique only requires a small amount of power and materials. It is thus smaller and less power consuming than other technologies using magnetic or electric fields for instance and does not require any preliminary tagging.

Acoustic levitation occurs when using standing ultrasonic waves trapped between two reflecting walls. If the ultrasonic wavelength ac is matched to the distance between the two walls (it has to be a certain number of the half wavelength), then an acoustic pressure field forces the particles or cells to move toward the region where the acoustic pressure is minimal (this region is called a pressure node) [1]. Once the particles or cells have reached the pressure node, they can be kept in so-called “acoustic levitation” as long as needed. They are literally trapped in an “acoustic tweezer”. Using this method, it is easy to force cells or particles to create large clusters or aggregates than can be kept in acoustic levitation as long as the ultrasonic field is on.

What happens if we illuminate the aforementioned aggregates of fluorescent particles or cells with a strong monochromatic (only one color) optic wave? If this wave is absorbed by the levitating objects, then the previously very stable aggregate explodes.

We can observe that the particles are now ejected from the illuminated aggregate at great speed from its periphery. But they are still kept in acoustic levitation, which is not affected by the introduction of light.

We determined that the key parameter is the absorption of light by the levitating objects because the explosions happened even with non-fluorescent particles. Moreover, this phenomenon exhibits a strong coupling between light and sound, as it needs the two sources of energy to be present at the same time to occur. If the particles are not in acoustic levitation, on the bottom of the cavity or floating in the suspending medium, even a very strong light does not move them. Without the adequate illumination, we only observe a classical acoustic aggregation process.

Using this light absorption property together with acoustic levitation opens the way to more complex and challenging experiments, like advanced manipulations of micro-objects in acoustic levitation or fast and highly selective sorting of mixed suspensions, since we can discriminate these particles not only on their mechanical properties but also on their optic ones.

We did preliminary experiments with living cells. We observed that human red blood cells (RBCs), having a strong absorption of blue light, could be easily manipulated by both sounds and light. We were able to break up RBCs aggregates very quickly. As a matter of fact, this new effect coupling both acoustics and light suggests all new perspectives for living cells manipulation and sorting, like cell washing (removing unwanted cells from the target cell).  Indeed, most of the living cells absorb light at different wavelengths and can already be manipulated using acoustic fields. This discovery should allow very selective manipulations and/or sorting of living cells in a very simple and easy way, using a low-cost setup.

Figure 1. Illustration of the acoustic manipulation of suspensions. A suspension is first focused under the influence of the vertical acoustic pressure field in red (a and b). Once in the pressure node, the suspension is radially aggregated c) by secondary acoustic forces [2]. On d), when we enlighten the stable aggregate with an adequate wavelength, this one laterally explodes.

Figure 2. (videos missing): Explosion (red_explosion) of the previously formed aggregate of 1.6 polystyrene beads, that are red fluorescent, by a green light. Explosion (green_explosion) of an aggregate of 1.7µm green fluorescent polystyrene beads by a blue light.

Figure 3 (videos missing): Illustration of the separation potential of the phenomenon. We take an aggregate (a) that is a mix of two kind of polystyrene particles with same diameter, one absorbing blue light and fluorescing green (b), the other absorbing green light and fluorescing red (c), that we cannot separate by acoustics alone. We expose this aggregate to blue light for 10 seconds. On the bottom row is shown the effect of this light, we effectively separated the blue absorbing particles (e) from the green absorbing one (f).

Movie missing – describes the observation from the top of the regular acoustic aggregation process of a suspension of 1.6µm polystyrene beads.

[1] K. Yosioka and Y. Kawasima, “Acoustic radiation pressure on a compressible sphere,” Acustica, vol. 5, pp. 167–173, 1955.

[2] G. Whitworth, M. A. Grundy, and W. T. Coakley, “Transport and harvesting of suspended particles using modulated ultrasound,” Ultrasonics, vol. 29, pp. 439–444, 1991.

1pEAa5 – A study on a friendly automobile klaxon production with rhythm

SangHwi Jee- slayernights@ssu.ac.kr
Myungsook Kim
Myungjin Bae
Sori Sound Engineering Lab
Soongsil University
369 Sangdo-Ro, Dongjak-Gu, Seoul, Seoul Capital Area 156-743
Republic of Korea

Popular version of paper 1pEAa5, “A study on a friendly automobile klaxon production with rhythm”
Presented Monday, December 04, 2:00-2:15 PM, Balcony N
174th ASA meeting, New Orleans

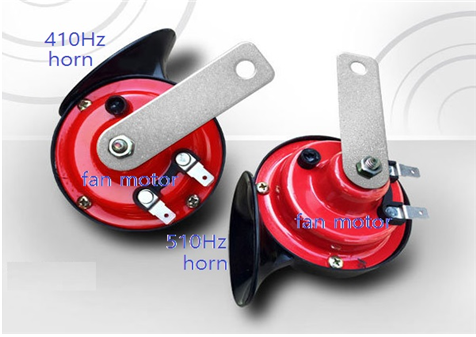
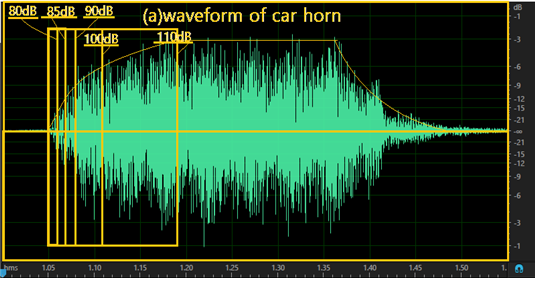
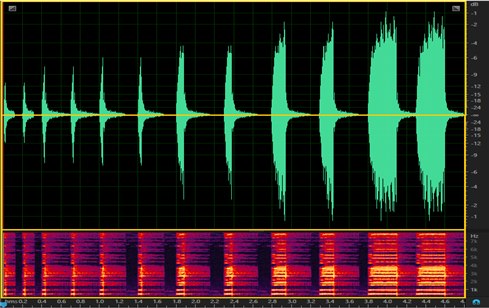
Cars are part of our everyday lives and as a result, traffic noise is always present when we are driving, riding as a passenger or walking down the street. Among the traffic noise, blaring car horns are among the most stressful and unpleasant sounds. Impulse noises, like those experienced from honking traffic horns can lead to emotional dysregulation or emotional hyperactivity of the driver and potentially cause an accident. While impulse sounds may be dangerous, the risk of avoiding car horn use altogether can be just as deadly. Not using horn sounds prevent us from informing pedestrians or other drivers of a potential accident. Although it is an important means of informing the pedestrians and other drivers of a present crisis, until now, car horn sounds and their impact on the listener have not been heavily studied. Generally, the Klaxon electromechanical car horn is a simple mechanical structure, which is excellent in durability and ease of use. However, once it is attached, it can’t change the tone of the horn sound or redesign the sound pressure size. Therefore, in this study, the width of power supply time of Klaxon was adjusted to 5 (0.01s, 0.02s, 0.03s, 0.06s, 0.13s). Then, the sound level of the Klaxon sound was set to 5 sound levels (80dB, 85dB, 90dB, 100dB, 110dB). The experimental result shows that the maximum sound pressure (pmax = 110dB) after operating the Klaxon is tmax.

Equation 1: Ps (dB) = 110 (dB) – {10log (ton / (ton + toff)) + 20log (ton / tmax)

In Equation 1, preferences were evaluated for five types of 5-second Klaxonsounds, which were designed with the Klaxon’s operating time and downtime appropriately adjusted. We performed 100 Mean Option Score (MOS) evaluations of the 5 types of Klaxons three times, then MOS evaluation, and started to listen to the existing Klaxon sounds of three times for 1 second to get the sound criterion. The evaluation items were MOS measurement for risk perception, loudness, unpleasantness, and stress. Results from the evaluation of preference, when designing various forms of the Klaxon sound, noted that giving the horn sound rhythm was preferred compared to the conventional horn sound when continuously heard for 5 seconds. When the rhythm was changed by the sound of Klaxon, the average perceived horn sound level decreased by 20dB. This can be heard in the human ear if the sound is rhythmic rather than normal. Hearing can be perceived as a simple tone, but rhythmic sound can also be perceived easily. In fact, it was found that the sound that when rhythm was added to a sound, it was found to be more pleasant than the corresponding normal sound

horns


3aPA3 – Standing Surface Acoustic Wave Enabled Acoustofluidics for Bioparticle Manipulation

Xiaoyun Ding- Xiaoyun.Ding@Colorado.edu
Department of Mechanical engineering
University of Colorado at Boulder
Boulder, CO 80309

Popular version of paper 3aPA3, “Standing Surface Acoustic Wave Enabled Acoustofluidics for Bioparticle Manipulation”
Presented Wednesday, December 06, 2017, 9:30-10:00 AM, Balcony L
174th ASA meeting, New Orleans

Techniques that can noninvasively and dexterously manipulate cells and other bioparticles (such as organisms, DNAs, proteins, and viruses) in a compact system are invaluable for many applications in life sciences and medicine. Historically, optical tweezers have been the primary tool used in the scientific community for bioparticle manipulation. Despite the remarkable capability and success, optical tweezers have notable limitations, such as complex and bulky instrumentation, high equipment costs, and low throughput. To overcome the limitations of optical tweezers and other particle manipulation methods, we have developed a series of acoustic-based, on-chip devices (Figure to the left) called acoustic tweezers that can manipulate cells and other bioparticles using sound waves in microfluidic channel. Cells viability and proliferation assays were also conducted to confirm the non-invasiveness of our technique. The simple structure/setup of these acoustic tweezers can be integrated with a small radio-frequency power supply and basic electronics to function as a fully integrated, portable, and inexpensive cell-manipulation system. Along with my colleagues, I have demonstrated that our acoustic tweezers can achieve the following functions: 1) single cell/organism manipulation [1]; 2) high-efficiency cell separation [2]; and 3) multichannel cell sorting [3].

Acoustic tweezers based single cell/organism manipulation
The acoustic tweezers I developed was the first acoustic manipulation method which can trap and dexterously manipulate single microparticles, cells, and entire organisms (i.e., Caenorhabditis elegans) along a programmed route in two-dimensions within a microfluidic chip [1]. We demonstrate that the acoustic tweezers can move a 10-µm single polystyrene bead to write the word “PNAS” and a bovine red blood cell to trace the letters “PSU” (Figure to the right). It was also the first technology capable of touchless trapping and manipulating Caenorhabditis elegans, a one-millimeter long roundworm that is one of the most important model systems for studying diseases and development in humans. To the best of our knowledge, this is the first demonstration of non-invasive, non-contact manipulation of C. elegans, a function that is challenging for optical tweezers.

Acoustic tweezers based high-efficiency cell separation
Simple and high-efficiency cell separation techniques are fundamentally important in biological and chemical analyses such as cancer cell detection, drug screening, and tissue engineering. In particular, the ability to separate cancer cells (such as leukaemia cells) from human blood can be invaluable for cancer biology, diagnostics, and therapeutics. We have developed an standing surface acoustic wave based cell separation technique that can achieve high-efficiency (>95%) separation of human leukemia cells (HL-60) from human blood cells and high efficiency separation of breast  cancer cells from human blood based on their size difference (Figure to the right). This method is simple and versatile, capable of separating virtually all kinds of cells (regardless of charge/polarization or optical properties) with high separation efficiency and low power consummation.

Acoustic tweezers based multichannel cell sorting
Cell sorting is essential for many fundamental cell studies, cancer research, clinical medicine, and transplantation immunology. I developed an acoustic-based method that can precisely sort cell into five separate outlets of cells (Figure to the right), rendering it particularly desirable for multi-type cell sorting [3]. Our device requires small sample volumes (~100 μl), making it an ideal tool for research labs and point-of-care diagnostics. Furthermore, it can be conveniently integrated with a small power supply, a fluorescent detection module, and a high-speed electrical feedback module to function as a fully integrated, portable, inexpensive, multi-color, miniature fluorescence-activated cell sorting (μFACS) system.


 References:

  1. Xiaoyun Ding, et al., On-Chip Manipulation of Single Microparticles, Cells, and Organisms Using Surface Acoustic Waves, Proceedings of the National Academy of Sciences of the United States of America (PNAS), 2012, 109, 11105-09,.
  2. Xiaoyun Ding, et al., Cell separation using tilted-angle standing surface acoustic waves, Proceedings of the National Academy of Sciences of the United States of America (PNAS), 111, 12992-12997 (2014).
  3. Xiaoyun Ding, et al., Standing surface acoustic wave (SSAW) based multichannel cell sorting, Lab On a Chip, 2012,12, 4228–31,. (COVER ARTICLE)
  4. Xiaoyun Ding, et al., Lab on a Chip, 2012, 12, 2491-97. (COVER ARTICLE)

2pBA2 – Medical ultrasound imaging for the detection of netrin-1 in breast cancer

Jennifer Wischhusen- jennifer.wischhusen@inserm.fr
Rodolfo Molina
Frederic Padilla
LabTAU U1032, INSERM
French National Institute of Health and Medical Research
University of Lyon
Lyon, France

Jean-Guy Delcros
Benjamin Gibert
Patrick Mehlen
Cancer Research Center Lyon
French National Institute of Health and Medical Research
University of Lyon
Lyon, France

Katheryne E. Wilson
Juergen K. Willmann
Radiology, MIPS, School of Medicine
Stanford University
Stanford, CA, United States

Popular version of paper 2pBA2, “Ultrasound molecular imaging of the secreted tumor marker Netrin-1 in multiple breast cancer models”
Presented Monday, December 04, 2017, 1:15-1:30 PM, Balcony N
174th ASA meeting, New Orleans

Cancer is a disease that is defined by uncontrolled growth of cells in our body. The aberrant growth is caused by genetic errors which lead either to the gain of growth signals or the loss of growth inhibitors. Both scenarios result in normal cells growing and replicating in abnormal ways and leading to tumors. Today, molecularly targeted therapies aim at re-establishing the equilibrium of cell growth regulators in order to stop tumor growth. Unfortunately, the abnormal signals causing tumors can vary between patients. In fact, even different tumors in the same patient can have different underlying growth signals. This phenomenon is called heterogeneity. It is crucial to understand which abnormal signaling molecules are causing the patient’s tumor prior to treatment. With this information, a physician can make a more educated decision on treatment choices for each patient and their particular tumor in order to increase the chances for a positive response to therapy. This new approach is known as personalized or precision medicine.

breast cancer

Figure 1: Differences in molecular composition between different tumors. The tumor of the right patient presents netrin-1 and makes the patient eligible for netrin-1-targeted therapy. The patient on the left lacks netrin-1 and requires an alternative therapy.

Netrin-1 is a tumor-stimulating molecule which was discovered to contribute to tumor growth in different types of cancer, including 60% of metastatic breast cancer (most frequent type of cancer in women worldwide). A therapy was developed aiming at the inhibition of netrin-1’s activity and reducing tumor growth. Only tumors presenting netrin-1 are expected to benefit from netrin-1-targeted therapy while tumors without netrin-1 require alternative therapies (Figure 1). To identify breast cancer patients presenting netrin-1, we propose the use of medical ultrasound imaging. To do so, we used microbubbles, which serve as a contrast medium in ultrasound imaging. These microbubbles were modified to recognize the netrin-1 molecule when injected into the blood circulation (Figure 2).

breast cancer

Figure 2: With medical ultrasound, microbubble contrast medium can be detected. In tumors lacking netrin-1, no microbubbles accumulate and only weak background signal is detected. In tumors presenting netrin-1, netrin-1-targeting microbubbles accumulate and generate a strong signal in ultrasound imaging.

In an imaging study, the signal of netrin-1-targeted microbubbles and control microbubbles was collected from breast tumors that were known to either present netrin-1 or lack netrin-1. Our results showed an increased signal with netrin-1-targeted microbubbles in netrin-1-presenting tumors while a much lower signal was observed with control microbubbles in the same tumors (Figure 3). Tumors that lacked netrin-1 showed no accumulation of netrin-1-targeted microbubbles.

breast cancer

Figure 3: Medical ultrasound imaging with netrin-1-targeted microbubbles. Netrin-1-targeted microbubbles accumulate in breast tumors that present netrin-1 and were shown to cause a higher imaging signal than control microbubbles. The difference in imaging signal was verified by statistical analysis (*: with an e

In conclusion, our imaging study showed that these netrin-1-targeted microbubbles enable the non-invasive and near real-time visualization of netrin-1 in breast tumors using medical ultrasound imaging. We are convinced that medical ultrasound imaging can allow the detection of tumor-promoting molecules, such as netrin-1, and enable personalized medicine, which means to diagnose the molecular profile of breast cancer patients and adapt the therapy approach to the specific needs of the patient.

3aPPa3 – When cognitive demand increases, does the right ear have an advantage?

Danielle Sacchinelli  -dms0043@auburn.edu
Aurora J. Weaver – ajw0055@auburn.edu
Martha W. Wilson – paxtomw@auburn.edu
Anne Rankin Cannon- arc0073@auburn.edu
Auburn University
1199 Haley Center
Auburn, AL 36849

Popular version of 3aPPa3, “Does the right ear advantage persist in mature auditory systems when cognitive demand for processing increases?”
Presented Wednesday morning, December 6, 2017, 8:00-12:00 AM, Studios Foyer
174th ASA Meeting, New Orleans
Click here to read the abstract

A dichotic listening task presents two different sound sequences simultaneously to both ears. Performance on these tasks measures selective auditory attention for each ear, either binaural separation or binaural integration (see Figure 1 for examples). Based on the anatomical model of auditory processing, the right ear has a slight advantage, compared with the left ear, on dichotic listening tasks. This is due to left brain hemispheric dominance for language, which receives direct auditory input from the right ear (i.e., strong contralateral auditory pathway; Kimura, 1967).

Clinical tests of auditory function quantify this right ear advantage for dichotic listening tasks to assess maturity of the auditory system, in addition to other clinical implications. Accurate performance on dichotic tests relies on both sensory organization and memory. As a child matures, the right ear advantage decreases until it is no longer clinically significant. However, clinically available dichotic-digits tests use only 1, 2, (e.g., Dichotic digits test; Musiek, 1983; Musiek, et al., 1991) or 3 (i.e., Dichotic DigitsMAPA; Schow, Seikel, Brockett, & Whitaker, 2007) digit sets in each ear for testing. See Figure 1 for maximum task demands of clinical tests for binaural integration, instructions “B”, using free recall protocol (Guenette, 2006).

Daily listening often requires an adult to process competing information that extends six items of sensory input. This study investigated the impact of increasing cognitive demands on ear performance asymmetries (i.e., right versus left) in mature auditory systems. Forty-two participants (i.e., 19-28 year-olds) performed dichotic binaural separation tasks (adapted from the Dspan Task; Nagaraj, 2017), for 2, 3, 4, 5, 6, 7, 8, and 9-digit lists. Listeners recalled the sequence presented to one ear while ignoring the sequence presented to the opposite ear (i.e., binaural separation; directed ear protocol). See Figure 1 for an example of the experimental binaural separation tasks (i.e., digit length = 3 used for condition 2) and instructions “A” for directed ear recall.

Results in Figure 2 show a significant effect for directed ear performance as task demands increase (i.e., digit list length). The overall evaluation of the list length (Figure 2) does not reveal the impact of working memory capacity limits (i.e., maximum items that can be recalled for an ongoing task) for each participant. Therefore, a digit span was measured to estimate each participant’s simple working memory capacity. Planned comparisons for ear performance relative to a participant’s digit span (i.e., below = n-2, at span = n, and above span = n+2 digit lists, where n = digit span) evaluated the role of cognitive demand on ear asymmetries.

Planned t-test comparisons revealed a significant performance asymmetry above span (i.e., n+2). No significant differences were identified for performance relative to, or below, an individual’s simple memory capacity. This indicates the persistence of the right ear advantage in mature auditory systems when listening demands exceeded an individual’s auditory memory capacity.

Overall, the study found the right ear continues to show better performance on dichotic listening tasks, even in mature adults. This persistent right ear advantage occurred when the number of digits in the sequence exceeded the participants’ digit span capacity. We believe such demands are a realistic aspect of every day listening, as individuals attempt to retain sensory information in demanding listening environments. These results may help us modify existing clinical tests, or develop a new task, to more precisely reveal performance asymmetries based on an individual’s auditory working memory capacity.

Figure 1. Displays an example of dichotic digit stimuli presentation, with both “A” binaural separation tasks (i.e., directed ear) and “B” binaural integration (i.e., free recall) instructions.

Figure 2. Displays ear performance on the binaural separation task across all participants. Note: the orange box highlights the maximum demands of commercially available dichotic-digits tests; participant performance reflects a lack of asymmetry under these cognitive demands.

Figure 3. Displays participant ear performance on the binaural separation task relative to digit span.

  1. Kimura, D. (1967). Functional asymmetry of the brain in dichotic listening. Cortex, 3(2), 163- 176.
  2. Musiek, F., (1983). Assessment of central auditory dysfunction: The dichotic digit test revisited. Ear and Hearing, 4(2), 79-83.
  3. Musiek, F., Gollegly, K., Kibbe, K., & Verkest-Lenz, S. (1991). Proposed screening test for central auditory disorders: Follow-up on the dichotic digits test. The AmericanJournal of Otology, 12:2, 109-113.
  4. Schow, R., Seikel, A., Brockett, J., Whitaker, M., (2007). Multiple Auditory Processing Assessment (MAPA); Test Manual 1.0 version. AUDITEC, St. Louis, MO. PDF available from http://www2.isu.edu/csed/audiology/mapa/MAPA_Manual.pdf
  5. Guenette, L.A. (2006). How to administer the Dichotic Digit Test. The Hearing Journal, 59 (2), 50.
  6. Nagaraj, N. K. (2017). Working Memory and Speech Comprehension in Older Adults with Hearing Impairment. Journal of Speech Language and Hearing Research, 60(10), 2949-2964. doi: 10.1044/2017_JSLHR-H-17-0022.