3pSA – Diagnosing wind turbine condition employing a neural network to the analysis of vibroacoustic signals

Andrzej Czyzewski
Gdansk University of Technology, Multimedia Systems Department
80-233 Gdansk, Poland
www.multimed.org
e-mail: multimed.org@gmail.com

Popular version of paper 3pSA 
Presented Wednesday afternoon, December 4, 2019
178th ASA Meeting, San Diego, California

The maintenance of wind turbines sums up to approx. 20-35% of their life-cycle costs. Therefore, it is important from the economic point of view to detect damage early in the wind turbines before failures occur. For this purpose, a monitoring system was built that analyzes both acoustic signals acquired from the non-contact acoustic intensity probe, as well as from the traditional accelerometers, mounted on the internal devices in the nacelle. The signals collected in this way are used for long-term training of the neural network. The appropriately trained network automatically detects deviations, signaling them to technical service. In this way, artificial intelligence is used to automatically monitor the technical condition of wind turbines.

Existing methods are mostly based on different types of accelerometers mounted on the blades of the wind turbine or on the bearings of the electric power generator. Contactless methods we develop provide many benefits (e.g. no need to stop the wind turbine for mounting of accelerometers). The main source of acoustic signals obtained without contact is a special multi-microphone probe that we have constructed. A special feature of this solution is the ability to precisely determine the direction from which the sound is received. Thanks to this, the neural network learns non-mixed up sounds emitted by mechanisms located in various places inside the turbine. The acoustical probe is presented in Figure 1, and the device containing electronic circuits for processing acoustic signals is shown in Figure 2.

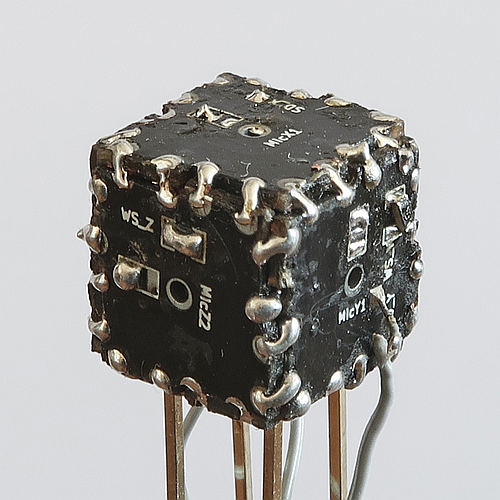
Figure 1 Acoustical probe (a) and complete acoustical vector sensor (b)

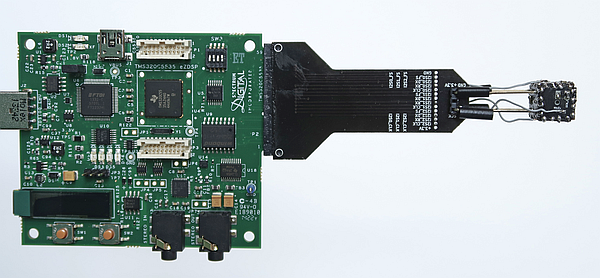
Figure 2 Device collecting vibroacoustic signals (a),

which also contains a neural network module that detects if these signals are abnormal (b).


In addition, we are also developing methods for visual surveillance of a wind farm, which by their nature belong to non-contact methods. We received encouraging results by amplifying the invisible vibrations in video. The method we applied is called the motion magnification in the video (invented by scientists from MIT). We used this approach for extracting information on the vibrations of the whole wind turbine construction. What comes out of this can be seen in the two short films pasted below, the first of which shows the original video image, and the second after applying the invisible pixel movements caused by vibrations and swaying of the wind turbine tower.

Video 1. Original video recording of a working wind turbine

Video 2. The same turbine as in Video 1 after applying the pixel movements magnification

Since image vibrations can be transformed into acoustic vibrations, we were able to propose a method for monitoring wind turbines using a kind of non-contact vibrometry based on video-audio technology.

The neural network depicted in Figure 3 is the so-called autoencoder. It learns to copy its inputs to its outputs prioritizing the most relevant aspects of the data to be copied. In this way, it extracts relevant data from complex signals, so it also becomes sensitive to unexpected changes in the acoustic and video data structure. Therefore, a properly trained network can be entrusted with the task of supervising a wind turbine, i.e. checking that everything is in order with it.

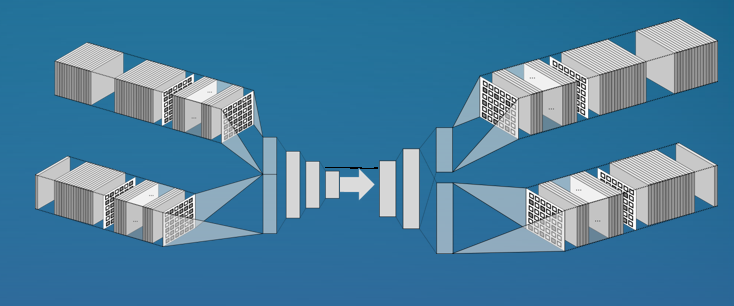
Figure 3 Autoencoder neural network architecture, reflecting the principle that the encoder on the left sends only a minimal amount of relevant data, and yet the decoder on the right can reproduce the same information that the entire network sees on its inputs.

The research was subsidized by the Polish National Centre for Research and Development within the project “STEO – System for Technical and Economic Optimization of Distributed Renewable Energy Sources”, No. POIR.01.02.00-00-0357/16.

1aSAb4 – Seismic isolation in Advanced Virgo gravitational wave detector

Valerio Boschi – valerio.boschi@ego-gw.it
European Gravitational Observatory
Istituto Nazionale di Fisica Nucleare
Sezione di Pisa
Largo B. Pontecorvo, 3
56127 Pisa, Italy

Popular version of paper 1aSAb4
Presented Monday morning, May 13th, 2019
177th ASA Meeting, Louisville, KY

Imagine to drop a glass of water in the ocean. Due to that the global level of all the seas on the Earth will increase by an extremely small amount. A rough estimate would lead you to this amazingly tiny displacement: 10-18 m !! This length is equivalent to the sensitivity of current gravitational wave (GW) detectors.

GWs are ripples of space-time, produced by the collapse of extremely dense astrophysical objects, like black holes or neutron stars. Those signals induce on the matter small variation of length (less than 10-18 m at 100 Hz) that can be detected only by the world most precise rulers, the interferometers.

Second generation gravitational wave interferometers like the Advanced Virgo experiment, shown in fig. 1, which is based in Cascina, Italy and the two US-based Advanced LIGO detectors, are collecting GW signals since 2015 opening the doors of the so-called multi-messenger astronomy.

Figure 1 Aerial View of Advanced Virgo (EGO/Virgo collaboration)

In order reach the required level of sensitivity of current interferometers many disturbances need to be strongly reduced. Seismic noise if not attenuated would represent the main limitation of current detectors. In facts, even in the absence of local or remote earthquakes, ground moves by mm in the frequency region between 0.3 and 0.4 Hz. This motion, called microseism, is caused by the continuous excitation of the Earth crust produced by the sea waves.

In this conference contribution we will present an overview of the seismic isolation systems used in Advanced Virgo GW interferometer. We will concentrate on the so-called super-attenuator, the seismic isolator used for all the detector main optical components, shown in fig. 2. This complex mechanical device is able to provide more than 12 orders of magnitude of attenuation above a few Hz. We will also describe its high-performance digital control system and the control algorithms implemented with it. Thanks to the performance and reliability of this system the current duty cycle of Advanced Virgo, is almost 90 %.

gravitational wave

Figure 2 Inside view of a super-attenuator

1pSA8 – Thermoacoustics of solids – Can heat generate sound in solids?

Haitian Hao – haoh@purdue.edu
Mech. Eng., Purdue Univ.
Herrick Labs,
177 S. Russell St.
Rm.1007
West Lafayette, IN 47906

Carlo Scalo
Mech. Eng., Purdue Univ.
Herrick Labs,
177 S. Russell St.
Rm.1007
West Lafayette, IN 47906

Mihir Sen
Aerosp. and Mech. Eng.
Univ. of Notre Dame,
Notre Dame, IN

Fabio Semperlotti
Mech. Eng.
Purdue Univ.
West Lafayette, IN

Popular version of 1pSA8, “Thermoacoustic instability in solid media”
Presented Monday, May 07, 2018, 2:45pm – 3:00 PM, Greenway C
175th ASA Meeting, Minneapolis
Click here to read the abstract

Many centuries ago glass blowers observed that sound could be generated when blowing through a hot bulb from the cold end of a narrow tube. This phenomenon is a result of thermoacoustic oscillations: a pressure wave propagating in a compressible fluid (e.g. air) can sustain or amplify itself when being provided heat. To date, thermoacoustic engines and refrigerators have had remarkable impacts on many industrial applications.

After many centuries of thermoacoustic science in fluids, it seems natural to wonder if such a mechanism could also exist in solids. Is it reasonable to conceive thermoacoustics of solids? Can a metal bar start vibrating when provided heat?

The study of the effects of heat on the dynamics of solids has a long and distinguished history. The theory of thermoelasticity, which explains the mutual interaction between elastic and thermal waves, has been an active field of research since the 1950s. However, the classical theory of thermoelasticity does not address instability phenomena that can arise when considering the motion of a solid in the presence of a thermal gradient. In an analogous way to fluids, a solid element contracts when it cools down and expands when it is heated up. If the solid contracts less when cooled and expands more when heated, the resulting motion will grow with time. In other terms, self-sustained vibratory response of a solid could be achieved due to the application of heat. Such a phenomenon would represent the exact counterpart in solids of the well-known thermoacoustic effect in fluids.

By using theoretical models and numerical simulations, our study indicates that a small mechanical perturbation in a thin metal rod can give rise to sustained vibrations if a small segment of the rod is subject to a controlled temperature gradient. The existence of this physical phenomenon in solids is quite remarkable, so one might ask why it was not observed before despite the science of thermoacoustics have been known for centuries.

solid-state thermoacoustic device

“Figure 1. The sketch of the solid-state thermoacoustic device and the plot of the self-amplifying vibratory response.”

It appears that, under the same conditions of mechanical excitation and temperature, a solid tends to be more “stable” than a fluid. The combination of smaller pressure oscillations and higher dissipative effects (due to structural damping) in solids tends to suppress the dynamic instability that is at the origin of the thermoacoustic response. Our study shows that, with a proper design of the thermoacoustic device, these adverse conditions can be overcome and a self-sustained response can be obtained. The interface conditions are also more complicated to achieve in a solid device and dictates a more elaborate design.

Nonetheless, this study shows clear theoretical evidence of the existence of the thermoacoustic oscillations in solids and suggests that applications of solid-state engines and refrigerators could be in reach within the next few years.

2pSA – Seismic-infrasound-acoustic-meteorological sensors to dynamically monitor the natural frequencies of concrete dams

Henry Diaz – Alvarez – henry.diaz-alvarez@usace.army.mil
Luis De Jesus-Diaz – Luis.A.DeJesus-Diaz@erdc.dren.mil
Vincent P. Chiarito – Vincent.P.Chiarito@usace.army.mil
Chris P. Simpson – Christopher.P.Simpson@usace.army.mil
Mihan H. McKenna – Mihan.H.McKenna@usace.army.mil

U.S. Army Engineer Research and Development Center
Geotechnical and Structures Laboratory
3909 Halls Ferry Road,
BLDG 5014Vicksburg, MS 39180

Popular version of 2pSA, “Seismic-Infrasound-Acoustic-Meteorological Sensors to Dynamically Monitor the Natural Frequencies of Concrete Dams”
Presented Tuesday afternoon, May 8, 2018, 1:00-3:45 PM
175th ASA Meeting, Minneapolis
Click here to read the abstract

The U.S. Army Engineer Research and Development Center (ERDC) is leading research using seismic-infrasound-acoustic-meteorological (SIAM) arrays to determine structural characteristics of critical infrastructure. Fundamental, vibrational modes of motion for large structures, such as dams, are usually in the sub-audible, infrasound frequency range. Infrasound is low-frequency, sub-audible sound, traditionally defined to be between 0.1 to 20 Hz and below the range of human hearing from 20 Hz to 20,000 Hz [1]. To validate the concept and its potential use for monitoring flood control structures, a structural evaluation was conducted at the Portugues Dam in Ponce, Puerto Rico.

The dam’s dynamic properties were studied prior to the deployment of SIAM arrays using detailed finite element models (FEM) assembled in COMSOL Multiphysics software [2].  The natural frequencies of 4.8 Hz and 6.7 Hz, respectively, were determined for the lower modes of vibrations, shown in Figure 1[3].


Figure 1. Modal analysis of the Portugues dam using COMSOL  multiphysisc software. Vibration mode 1 (a) and vibration mode 2 (b)

To validate the results from the FEM dynamic analysis, Performance Based Testing (PBT) was conducted at the dam.  The PBT consisted of measuring the crest input and output response to an ambient excitation using an array of accelerometers along each monolith.

Power Spectra Density (PSD) analysis of the data from accelerometers was used to confirm the natural resonance frequencies in the dam (Figure 2), and was also used to develop an estimate of the response shape associated with the fundamental modes of vibration developed in the FEM (Figure 1).


Figure 2. Power Spectra Density (PSD) analysis from accelerometers gages due to ambient excitation of the dam.

Instrumentation for a SIAM array consists of five IML infrasound sensors each with four porous hose wind filters (Figure 3), three audible microphones, a 1 Hz triaxial seismometer, and two RefTek 130s digitizers. To triangulate the specific source location of the infrasound, at least three SIAM arrays are required during the field data collecton. Typically one array in deployment also utilizas a bi-level meterorogical station.

seismic-infrasound-acoustic-meteorological
Figure 3. Example of one SIAM array used during test in the Cerrillo area.

A total of three SIAM arrays were used to monitor the dam at distances of 0.46 km Upstream (CPBBR), 0.2 km Downstream (Gazebo), and 6.0 km (Cerrillo) from the dam as shown in Figure 4.

seismic-infrasound-acoustic-meteorological
Figure 4. Illustration of the SIAM array location during the data collection.

An example time-series from a single infrasound sensor at the downstream array with ambient excitation highlighted is shown in Figure 5. The PSD analysis for ambient excitation in Figure 6. shows correlated energy at frequencies 4.3 Hz and 6.0 Hz, which align with the vibrations modes measured on structure with acelerometers. Results from both the FEM using COMSOL Multiphysics agree with the infrasound field experimental data and were used to validate to SIAM array data collected.

 
Figure 5. Raw data from a single infrasound sensor located at the downstream array


Figure 6. PSD analysis from infrasound sensors, located at the Downstream array, ambien excitation.

Performing an infrasound survey of Portugues Dam provides an opportunity to validate whether infrasound’s can be used to remotely determine the fundamental frequencies of vibration of large structures. Infrasound waves are capable of propagating at a significant standoff distance from the source structure. Potential benefits of infrasound monitoring include the determination of a structure’s health without a physical inspection and also passive monitoring of several structures of interest using relatively few SIAM arrays.

[1] P. Campus, D. R. Christie, “Worldwide observations of infrasonic waves” in Infrasound Monitoring for Atmospheric Studies, edited by A. Le Pichon, E. Blanc, A. Hauchecorne (Springer, Dordrecht, 2010), pp. 185–234.
[2] COMSOL Multiphysics® v. 5.2. www.comsol.com. COMSOL AB, Stockholm, Sweden
[3] H. Diaz-Alvarez, V.P Chiarito, S. McComas, and M.H McKenna. (2015). Infrasound Assessment of the Roller Compacted Concrete Dam: Case Study of the Portugues Dam in Ponce, PR. COMSOL conference 2015, Newton, MA. (2015)

4aSAb12 – Designing Tunable Acoustic Metamaterials Using 3-D Computer Graphics

Mark J. Cops – mcops@bu.edu
J. Gregory McDaniel – jgm@bu.edu
Boston University
110 Cummington Mall
Boston, MA 02215

Elizabeth A. Magliula – Elizabeth.magliula@navy.mil
Naval Undersea Warfare Center
1176 Howell Street, Building 1302
Newport, RI 02841

Popular version of paper 4aSAb12
Presented Wednesday morning, June, 28, 2017
173rd ASA Meeting, Boston

In this work, software originally designed for display rendering, artistic graphics, animation creating, and video game creation is being used to create new materials with tunable properties. This work has produced digital designs of materials that are essential to reducing sound and vibration.

Metamaterials are specially engineered materials which use a combination of structure and host materials to enable a wide range of material properties not ordinarily found in nature. Metallic foams are one such subset of metamaterials, which provide advantages for structural applications due to their high strength-to-weight ratio. Metallic foams can be manufactured through a variety of processes, such as casting or sintering, and can either be closed cell or open cell (Figure 1).

Figure 1. An open cell aluminum foam manufactured by ERG Aerospace Corp.

The ability to tune metallic foam properties for various noise and vibration mitigation applications is a valuable tool for industrial designers and engineers. The combination of 3-D computer graphics and finite-element software can be used to rapidly design, investigate, and classify material properties. OpenGL is a programming language used widely in computer graphics. Using OpenGL, the programmer can create complex cellular structures by effectively controlling the pixel display in a 3-D array of pixels by using signed distance functions to specify locations of solid material or void space. One remarkable thing about using OpenGL is its inherent simplicity and ability to create any surface described mathematically. Two such materials, created from the described approach, are shown in Figure 2.

Figure 2. (a) an Aluminum tetrahedron lattice with triangular struts. (b) A copper minimal surface geometry structure.

The relative density of these two foams was altered by keeping the pore spacing (the distance between void openings in the surface) constant and increasing the thickness of material. To determine effective materials properties, the designed foam structures were analyzed using the finite element method software, Abaqus. Six different strain loading scenarios were imposed on the structure: representing tensile and shear loading on all orientations, shown in Figure 3.

Metamaterials

Figure 3. Strain loading scenarios used in determining effective material properties.

We then determined numerically the effective static material properties, such as Young’s modulus and Poisson ratio. Figure 4 shows relative Young’s Modulus and Poisson ratio values vs. relative density for the foam in Figure 2b. Each blue point is one foam that was digitally designed and analyzed by the discussed approach. It is interesting to note that there is a very significant trend — properties are a quadratic function of relative density.

Figure 4. Material property curves for the foam in Figure 2b.

The useful feature about curves such as those in Figure 4, and others generated by the discussed approach, is the ability for designers to visualize the design space and availability of material properties and select a desired relative density foam to meet design criteria. Such foams can then be fabricated and implemented to serve a wide range of structural applications.

2pSAa – Three-in-one Sound Effects: A redirecting antenna, beam splitter and a sonar

Andrii Bozhko – AndriiBozhko@my.unt.edu
Arkadii Krokhin – Arkadii.Krokhin@unt.edu
Department of Physics
University of North Texas
1155 Union Circle #311427
Denton, TX 76201, USA

José Sánchez-Dehesa – jsdehesa@upvnet.upv.es
Francisco Cervera – fcervera@upvnet.upv.es
Wave Phenomena Group
Universitat Politècnica de València
Camino de Vera s/n
Valencia, ES-46022, Spain

Popular version of paper 2pSAa, “Redirection and splitting of sound waves by a periodic chain of thin perforated cylindrical shell.”
Presented Monday afternoon, June 26, 2017, 2:20, Room 201
173rd ASA Meeting, Boston

Any sound, whether the warble of an exotic bird or the noise of clucky machinery, what scientists percieve is a complex mixture of many primitive sound waves — the so-called pure tones, which are simply vibrations of certain distinct frequencies. So, is it possible, we wondered, to break down such an acoustic compound into its constituents and separate one of those pure tones from the rest?

It can be achieved using any of the signal processing techniques, however, a simple mechanistic solution also exists in the form of a passive system. That is to say, one that doesn’t have to be turned on to operate.

Here we demonstrate such a system: A linear, periodic arrangement of metallic perforated cylindrical shells in air (see Fig. 1), which serves as a redirecting antenna and a splitter for sound within an audible range.

Figure 1 – A periodic array of perforated cylindrical shells mounted outside the Department of Electronic Engineering, Polytechnic University of Valencia. Credit: Sánchez-Dehesa

Each shell in the chain (see Fig. 2) is a weak scatterer, meaning the sound wave would pass through it virtually undistorted, and strong redirection of an incoming signal might occur only if the chain is sufficiently long. When the number of shells in the chain is large enough, e.g. several dozens, each shell participates in a collective oscillatory motion, with each one of them transferring its vibration to its neighbor via the environment. Such a self-consistent wave is referred to as an eigenmode of our system, and it is best thought of as collective oscillations of air localized in the vicinity of the shells’ surfaces.

Figure 2 – A close-up of an aluminum perforated cylindrical shell. Credit: Sánchez-Dehesa

Now, there are two substantial concepts regarding the wave motion that deserve careful clarification. When describing an acoustic wave, we can look at how and where the regions of maximum (or minimum) pressure move through the medium (air in this case), and combine the information with that of the pace and direction of their motion into a single characteristic — called the phase velocity of the wave.

Another important property of the wave is its group velocity, which indicates how fast and in which direction the actual sound propagates. In many cases, the phase velocity and the group velocity of the wave have the same direction (the case of normal dispersion), but it is also not uncommon for the group velocity of a wave to be opposite to the phase velocity (the case of anomalous dispersion).

The idea of exploiting the fundamental eigenmodes of our system with either normal or anomalous dispersion is what enables the chain of perforated shells to redirect and focus sound. Namely, an acoustic signal that impinges on the chain can trigger the collective vibration of the shells – the eigenmode – and, thus, launch a wave running along the chain.

Of course, most of the sound would pass through the chain, but nevertheless the amount of energy that is redirected along the chain in the form of an eigenmode is quite noticeable. The eigenmode excitation only occurs if the phase velocity of the eigenmode matches that of the incoming signal, and for a specific incident angle, the matching condition supports several frequencies within the audible range.

What is crucial here is that the dispersion of the chain’s eigenmodes on those frequencies is alternating between normal and anomalous, which means that varying only the frequency of the incident acoustic wave (with everything else remaining unchanged) one can virtually switch the direction of the eigenmode propagation along the chain.

Animation 1 – An acoustic wave of frequency 2625 Hz is incident on the chain of perforated shells at the angle of 10o. The excited eigenmode having anomalous dispersion propagates down the chain. Credit: Bozhko

Animation 2 – Same as in animation 1, but the frequency is 3715 Hz, with the excited eigenmode having normal dispersion now. The redirected sound then propagates upwards along the chain. Credit: Bozhko

Animations 1 and 2 illustrate such intriguing behavior of the chain of perforated shells. In one case, the eigenmode that is excited has normal dispersion and carries energy upwards along the chain. In the other case, the dispersion is anomalous and the eigenmode travels downwards. The 10° incidence angle of the sound in both cases is the same, but the frequencies are different.

One possible application of such a redirecting antenna would be an acoustic beam splitter. Indeed, if an incoming signal has a wide spectrum of frequencies, then two pure tones with frequencies depending on the parameters of the chain and the angle of incidence can be extracted and redirected along the chain.

Due to different dispersion behavior of the eigenmodes corresponding to these two tones, the eigenmodes propagate in opposite directions. Thus, splitting of two pure tones becomes possible if we use a chain of perforated shells. Since the frequencies of the eigenmodes change smoothly with changing incidence angle, this angle can be recovered. This means that the chain may also serve as a passive acoustic detector which determines the direction to the source of incoming signal.