(Undercut or side cut of bars for making musical sound?)
Junehee Yoo – yoo@snu.ac.kr Seoul National University Kwanak-ro 1, Kwanak-gu Seoul, 08826 Republic of Korea
Thomas D. Rossing– rossing@somecompany.com Some Company 123 Industry Drive Industry Town, OH 54321
Popular version of paper 3aMU5 Presented Tuesday morning, June 27, 2017 173rd ASA Meeting, Boston
When you hit a rectangular bar, it makes sound. But the sound is not necessarily nice to hear because the higher mode frequencies are not tuned in harmony. Empirically, people have gotten to know that changing geometrical shapes is a way of tuning sounds. For example, undercutting the bars, like for xilophone or marimba bars is a familiar method. The middle part of each bar is undercut and as a result the 1st mode frequency is lowered as the 2nd mode frequency becomes 4 times higher than the 1st [1]. This change of mode frequency ratios makes the good sound.
Figure.1 Mode Frequency Ration to Note Frequency (Marimba bars along with 5 Octave)
When we search for the frequency ratios of marimba bars along all 5 octaves, we found the same ratios as Figure 1. The frequency ratios of the 2nd mode frequency to the 1st mode frequency are shown as 4.0 in most bars except higher note bar [1]. This produces the tone quality of marimbas.
Are there any other ways of tuning rectangular bars? Korean stone chimes, called pyeongyeongs (Figure 2), provide another example of tuning sound by change geometrical shape of bars [2]. In Asian countries, stone chimes have been cherished musical instruments from the Stone ages [3].
Stone chimes have taken a number of different forms, but generally they have two legs which meet at a vertex. The longer leg is often called the drum, because it is where the chime is struck, and the shorter leg is called the femur or thigh. A Korean stone chime has 115o angle between the drum part and the femur part, and the concave curved base forms a smooth L-shape (Figure 3). The shape is said to be the “shape of the heaven that curves to cover the earth[4].”
Does the shape only have such a philosophical meaning without any acoustical meaning?
In this study, we examine the effects of geometry on the tuning and the sound quality of stone chimes. By changing the vertex angle from 0 o to 180 o and the shapes of the base line, we estimate modal shapes and modal frequencies by means of finite element methods, and these results are compared to modal shapes and frequencies of existing stones, determined by holographic interferometry and by experimental modal testing [2].
At the end, we can conclude the existing shape of Korean L-shape stone chime with 115o vertex angle and the concave curved base is the optimized one. Also, we measured and analyzed frequencies of historical 261 pyeongyeong stones mainly from the 14th to 19th centuries to confirm the above conclusion.
Figure 2. Pyeongyoung, Korean Stone Chime Set
Figure 3. Shape of a Stone Chime
Figure 4. First mode shapes and frequencies of chimelike models with varying vertex angles
Figure 5. Frequency-dependence on vertex angle α in chime like models: (a) Fundamental frequency and vertex angle, on alternative gyeong models. (b) Ratio frequencies of modes and vertex angle on alternative gyeong models.
References
Yoo, J., Rossing, T. D., and Lakin, B., Vibrational modes of five-octave concert marimbas. Proceedings of SMAC 03: Stockholm Musical Acoustics Conference 2003. 2003: p. 355-357.
Yoo, J. and Rossing, T. D., Geometrical effects on the tuning of Chinese and Korean stone chimes. Journal of Acoustical Society of America, 2006. 120: EL 78-83
Lehr, A., Designing chimes and carillons in history, Acta Acustica/Acustica, 1997. 83: 320-336
(In Korean): Lee, H., Akhakquebeom: Illstrated test on traditional music (The National Center for Korean Traditional Performing Arts, Seoul, 2000)
Greg Watts – g.r.watts@bradford.ac.uk Faculty of Engineering and Informatics University of Bradford Bradford West Yorkshire UK BD7 1DP
Popular version of 2aNSa1. Tranquillity in the city—Building resilience through identifying, designing, promoting, and linking restorative outdoor environments Presented at the 173rd ASA Meeting Boston, Massachusetts June 2017
Tranquil spaces can be found and made in the city, and their promotion and use by residents and visitors is an important means of building resilience. Studies have shown that spaces rated by visitors as tranquil are more likely to produce higher levels of relaxation and less anxiety that should ultimately result in health and well-being benefits.
Such spaces can therefore be classed as restorative environments. Tranquil spaces are characterized by a soundscape dominated by natural sounds and low levels of man-made noise. In addition, the presence of vegetation and wild life has been shown to be an important contributory factor. Levels of rated tranquillity can be reliably predicted using a previously developed model called TRAPT, and then used it to design and identify tranquil spaces, improve existing green spaces and develop Tranquillity Trails to encourage usage.
Tranquillity Trails are walking routes designed to enable residents and visitors to reflect and recover from stress while receiving the benefits of healthy exercise. This paper describes Tranquillity Trails designed for three contrasting areas. Predictions of the rated tranquillity have been made along these routes and feedback from users was elicited at one site that confirmed the expected benefits.
The aim is to design a route that starts near the center, is simple and safe to follow and will allow users to experience a relatively degree of tranquility despite being in an urban area. Clearly the challenge is greater in a city with higher concentrations of people and traffic than for a town. The first three TTs designed are in Bradford, Kingsbridge and Guildford. These are all in England, though further ones are currently being develop in the US, Ireland and Hong Kong.
In addition, an app for a smart mobile devices describing interesting features of this route together with a map and cursor showing current position is freely available from: http://www.handheldtours.co.uk/
Tuomas Virtanen – tuomas.virtanen@tut.fi Tampere University of Technology Korkeakoulunkatu 1 FI-33720 Tampere FINLAND
Popular version of 1aID1 – Computational analysis of acoustic events in everyday environments To be presented on Sunday morning, June 25, 2017, 8:20, Ballroom B 173rd Meeting of the Acoustical Society of America
Sound carries information about physical events in an environment. For example, when a car is passing by, we can perceive the approximate size and speed of the car by its sounds. The automatic recognition of sound events in everyday environments (see Figure 1) through signal processing and computer algorithms would therefore enable several new applications. For instance, robots, cars, and mobile devices could become aware of physical events in their surroundings. New surveillance applications could automatically detect dangerous events, such as glass breaking, and multimedia databases could be queried based on their content.
Figure 1: Sound event recognition methods analyse automatically events within an audio signal. Credit: Heittola/TUT.
However, automatic detection of sounds is difficult, since the acoustic characteristics of different sources can be very similar, and there is no single, specific acoustic property that could be utilised for recognition. Furthermore, in realistic environments, there are typically multiple sound sources present simultaneously and their acoustic sources interfere with one another, forming a complex mixture of sounds (see Figure 2).
Figure 2: Sound carries lots of information about physical events in everyday environments. Realistic sound scenes consist of multiple sources which form a complex mixture of sounds. Credit: Arpingstone.
In my keynote speech, I present a generic approach to sound event recognition that can be used to detect many different types of sound events in realistic, everyday environments. In this technique, computer algorithms use machine learning to compile a model for each detectable sound type based on a database of example sounds. Once these models have been obtained at the development stage, they can be deployed to provide an estimate of the sound events that are present in any input audio signal.
State-of-the-art machine-learning models and algorithms are based on deep neural networks [1]. They mimic the processing in the human auditory system by feeding the input audio signal through a sequence of layers that automatically learn hierarchical representations of input sounds (see Figure 3). In turn, these representations can be used to estimate and recognise which sounds are present in the input.
Figure 3: The processing layers of a deep neural network produce representations of the input having different abstraction levels. Credit: Çakır et al./TUT
A recent study conducted at Tampere University of Technology shows that it is possible to recognize 61 various types of everyday sounds, such as footsteps, cars, doors, etc. correctly 70% of the time in everyday environments, such as offices, streets, and shops (see Figure 4) [2]. The study also demonstrates how advanced neural network architectures can provide significant improvements in recognition accuracy. The accompanying video (Video 1) illustrates the recognition output of the methods in comparison to manually annotated sound events.
Figure 4: Automatic recognition accuracy (percentages) of some common sound events in a study conducted at Tampere University of Technology. Credit: Çakır et al./TUT
Video 1: Sound events automatically recognized from a street scene (orange bars). Manually annotated target sounds are illustrated with blue bars, and cases where the automatic recognition and manual annotation coincide with brown bars. Credit: Çakıret al./TUT.
References: [1] Y. Bengio. Learning Deep Architectures for AI”(PDF). Foundations and Trends in Machine Learning. 2 (1): 1–127, 2009
[2] E. Çakır, G. Parascandolo, T. Heittola, H. Huttunen, and T. Virtanen. Convolutional Recurrent Neural Networks for Polyphonic Sound Event Detection. IEEE/ACM Transactions on Audio, Speech, and Language Processing, Volume 25, Issue 6, 2017.
Popular version of 2pSC7. Seeing is treating: 3D electromagnetic midsagittal articulography (EMA) visual biofeedback for the remediation of residual speech errors. Presented at the 173rd ASA Meeting
Lips, teeth, and cheeks are the key ingredients of every great smile. For a speech therapist, however, they get in the way of seeing how the tongue moves during speech. This creates a challenge for treating speech sound errors in the clinic. Carefully coordinated movements of the tongue shape sound into speech. If you have ever heard someone say what sounds like a “w” for the “r” sound or make the “s” sound with a lisp, you have heard what can happen when the tongue does not move toward the right shape to create the sounds. When these errors persist into adolescence and adulthood, there can be major social consequences.
Preschool children and toddlers often make speech errors with the tongue that can make it difficult for them to be understood. Sounds like “k,” “s,” and “r” commonly have errors because saying them accurately requires high-level coordination of the muscles in the tongue. In fact, 15% of children, aged 4-6 years, have some delay or error in speech sound production, without any known cause.
Traditional speech therapy for these errors can include games, drills, and some work to describe or show how the sound should be produced. Many times, these errors can be resolved with less than a year of treatment. Sometimes, even with strong work in speech therapy, the speech errors continue into adolescence and adulthood. In these cases, being able to see how the tongue is moving and to provide a visualization of how it should move would be especially useful.
Opti-Speech is a technology that provides this visualization in the speech therapy room. With it, the patient’s tongue movement is displayed in real-time as he or she talks. The speech therapist can see how the tongue is moving and provide target shapes that help the client produce speech sounds correctly. It was developed by a team that included speech therapists, computer scientists, animators, and biomedical engineers in collaboration with a tech company, Vulintus, using hardware created by Northern Digital, Incorporated.
Tiny sensors are placed on the tongue and their positions are tracked in an electromagnetic field. The positions of the sensors are generated as a 3D animated tongue on a display screen. Using the animation, the speech therapist can identify how the target sound is produced in error, which is not possible without this visualization.
In 2008 in Dallas, Texas, I started working with a talented team that included an electrical engineer, a computer scientist, an animator, and two other speech therapists to create the Opti-Speech therapy technology. We imagined software that could show an animated version of a tongue, driven in real-time by the motion of the client’s tongue, that could be used to “show” clients how to produce the sounds better. Similar technology is used to improve golf swings — by showing the aspiring golfers an image of their swing superimposed on an ideal swing, improvements come more rapidly.
Why couldn’t this same concept be applied to speech, we wondered. With this in mind, the Opti-Speech project began. The engineers and animators worked on the software, the speech therapists tested early versions, and in my lab at Case Western Reserve University, we set out to better understand what the targets for speech sounds might be.
Figure 1: The motion of 5 sensors glued to the tongue animate the movement of the avatar tongue in real-time. Credit: Vick/CHSC
Just eight years later, I am proud that Cleveland Hearing and Speech Center was included in an NIH-funded phase II clinical trial of Opti-Speech. The technology uses the captured motion of sensors on the tongue to animate a real-time 3-D avatar tongue (see Figure 1). The speech therapist can set spherical targets to “show” the client how to shape the tongue for particular speech sounds. For those who have not had success with traditional speech therapy, the Opti-Speech clinical trial may be a great alternative.
It has been almost 18 months since CHSC started the Opti-Speech trial. Rebecca Mental, a CHSC staff speech-language pathologist and doctoral student at CWRU, designed the treatment sessions and is running them. To date, she has completed the treatment with eleven participants who range in age from 8 to 22 years. Each and every one of these individuals has put in many hours across 13 sessions to help us understand if Opti-Speech will be a treatment that will be beneficial to our clients.
With these cases behind us, I am pleased to report that I believe we have a powerful new approach for treating those speech sound errors the most resistant to improvement. All of the Opti-Speech participants were previously enrolled in speech therapy without resolving their speech errors. Many of these individuals came to us frustrated, expecting to encounter yet another unsuccessful run in therapy.
With Opti-Speech, most of these participants experienced a transformation in how they make speech sounds. The key to the success of Opti-Speech is giving the client an additional “sense” for producing speech. In addition to feeling the tongue move and hearing the sound, Opti-Speech clients can “see” the movements of the tongue and know, right away, if they have produced the sound correctly.
The Opti-Speech story is best told through the experience of one of our first participants. Nancy, as I will call her, was 22-year-old and had been in speech therapy throughout most of her early school years to work on the “r” sound. It was her junior year of high school when Nancy first became aware that her peers were making fun of her speech. As this continued, she started to notice that teachers had a difficult time understanding her. Before long, she started to question her own competence and abilities. Nancy is a server at a local restaurant. Her boyfriend said she frequently returned home from work in tears. Nancy says, “When I have to say an ‘r’ word, I try to mumble it so that people won’t hear the error, but then they ask me to repeat myself which makes me feel even more embarrassed.” Frustrated, Nancy again enrolled in speech therapy, trying a few different clinics, but she did not have any success changing her “r” sound. Her boyfriend began researching options on the internet and found out about the Opti-Speech clinical trial at CHSC. Nancy was soon enrolled in the trial. As her boyfriend said, “I feel like we wasted so much time trying other things and then we came here and, BAM, 10 sessions and she can say “r” like anyone else!” He says he could hear a difference in Nancy’s speech after two or three sessions. Nancy has remarked that the change has made her job so much easier. “I can actually tell people that I am a server now. I used to avoid it because of the “r” sound. And at work, I can say ‘rare’ and ‘margarita’ and customers can understand me!”
It has been three months since Nancy “graduated” from Opti-Speech treatment and everything is going great for her. She is enrolled in classes at community college and working as a server at a high-end restaurant. While she is incredibly proud of her new speech, she is, understandably, self-conscious about how her speech used to sound. While listening to a recording of her speech before Opti-Speech, tears fell from her eyes. Looking back on the past gave her such an incredible sense of how far she’s come. I am exhilarated to have met and talked with Nancy. It made me realize the power of imagination and collaboration for solving some of the greatest challenges we encounter in the clinic.
Every year at Cleveland Hearing and Speech Center, we see countless clients who have speech production errors that Opti-Speech may improve. We have a strong affiliation with researchers at CWRU and we have a talented team of speech therapists who can help to run the trial. In other words, CHSC is unique in the world in its ability to test new technologies for speech, hearing, and deafness. This is why CHSC is the only site in the world currently running the Opti-Speech clinical trial. Almost a century of collaboration, community support, and philanthropy has helped to create the perfect environment for bringing the most cutting-edge speech therapy to our region.
Keiichi Tajima – tajima@hosei.ac.jp Dept. of Psychology Hosei University 2-17-1 Fujimi, Chiyoda-ku Tokyo 102-8160 Japan
Stefanie Shattuck-Hufnagel – sshuf@mit.edu Research Laboratory of Electronics Massachusetts Institute of Technology 77 Massachusetts Avenue Cambridge, MA 02139 USA
Popular version of paper 1pSC12 Presented Sunday afternoon, June 25, 2017 173rd ASA Meeting, Boston
Learning pronunciation and listening skills in a second language is a challenging task. Languages vary not only in the vowels and consonants that are used, but also in how the vowels and consonants combine to form syllables and words. For example, syllables in Japanese are relatively simple, often consisting of just a consonant plus a vowel, but syllables in English tend to be more complex, containing several consonants in a row. Because of these differences, learning the syllable structure of a second language may be difficult.
For example, when Japanese learners of English pronounce English words such as “stress,” they often pronounce it as “sutoresu,” inserting what are called epenthetic vowels (underlined) between adjacent consonants and at the end of words [1]. Similarly, when asked to count the number of syllables in spoken English words, Japanese learners often over-estimate the number of syllables, saying, for example, that the one-syllable word, play, contains 2 syllables [2].
This may be because Japanese listeners “hear” an epenthetic vowel between adjacent consonants even if no vowel is physically present. That is, they may hear “play” as something like “puh-lay,” thus reporting to have heard two syllables in the word. In fact, a study has shown that when Japanese speakers are presented with a nonsense word like “ebzo,” they report hearing an “illusory” epenthetic vowel between the b and z; that is, they report hearing “ebuzo” rather than “ebzo,” even though the vowel u was not in the speech signal [3].
These tendencies suggest the possibility that Japanese learners may have difficulty distinguishing between English words that differ in syllable count, or the presence or absence of a vowel, e.g. blow vs. below, sport vs. support. Furthermore, if listeners tend to an extra vowel between consonants, then they might be expected to misperceive blow as below more often than below as blow.
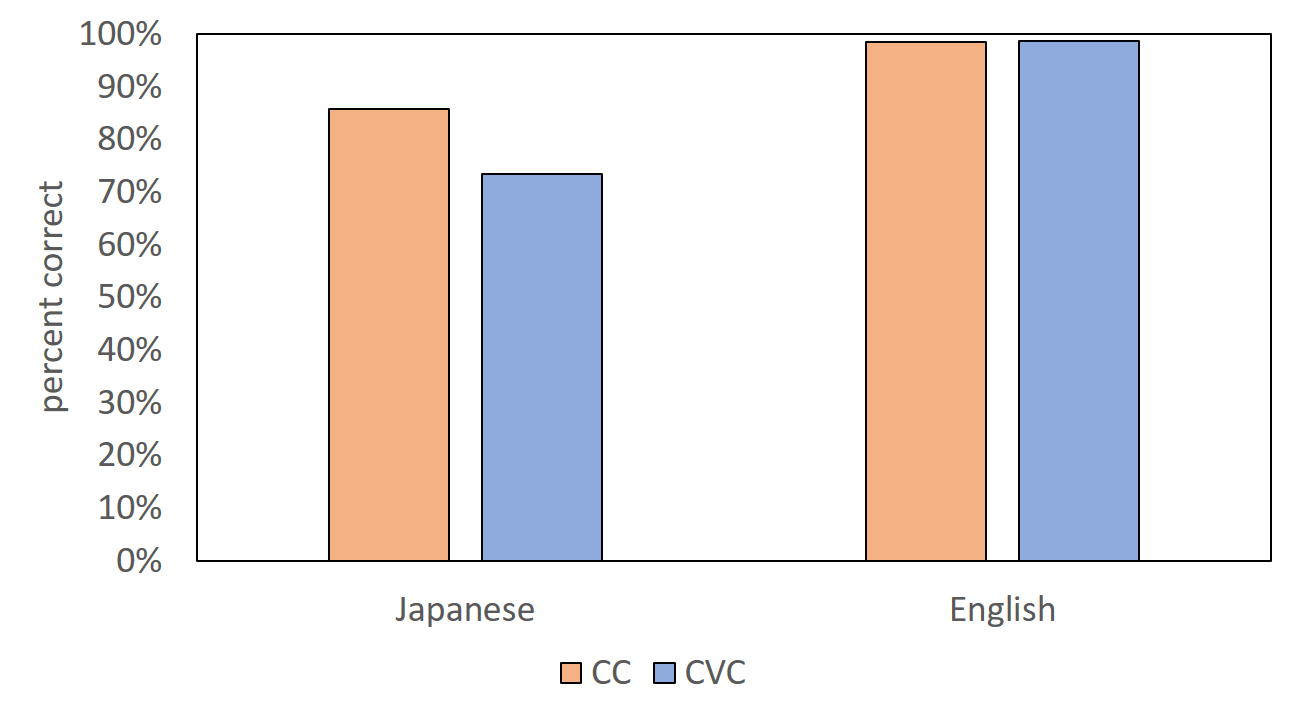
To test these predictions, we conducted a listening experiment with 42 Japanese learners of English as participants. The stimuli consisted of 76 pairs of English words that differed in the presence or absence of a vowel. Each pair had a “CC word” that contained a consonant-consonant sequence, like blow, and a “CVC word” that had a vowel within that sequence, like below. On each trial, listeners saw one pair of words on the computer screen, and heard one of them through headphones, as pronounced by a male native English speaker. The participants’ task was to pick which word they think they heard by clicking on the appropriate button. A control group of 14 native English participants also took part in the experiment.
Figure 1 shows the percentage of correct responses for CC words and CVC words for the Japanese learners of English (left half) and for the native English listeners (right half). The right half of Figure 1 clearly shows that the native listeners were very good at identifying the words; they were correct about 98% of the time. In contrast, the left half of Figure 1 shows that the Japanese listeners were less accurate; they were correct about 75~85% of the time. Interestingly, their accuracy was higher for CC words (85.7%) than for CVC words (73.4%), contrary to the prediction based on vowel epenthesis. Figure 1. Percent correct identification rate for CC words, e.g. blow, and CVC words, e.g. below, for Japanese learners of English (left half) and native English listeners (right half). Credit: Tajima/ Shattuck-Hufnagel
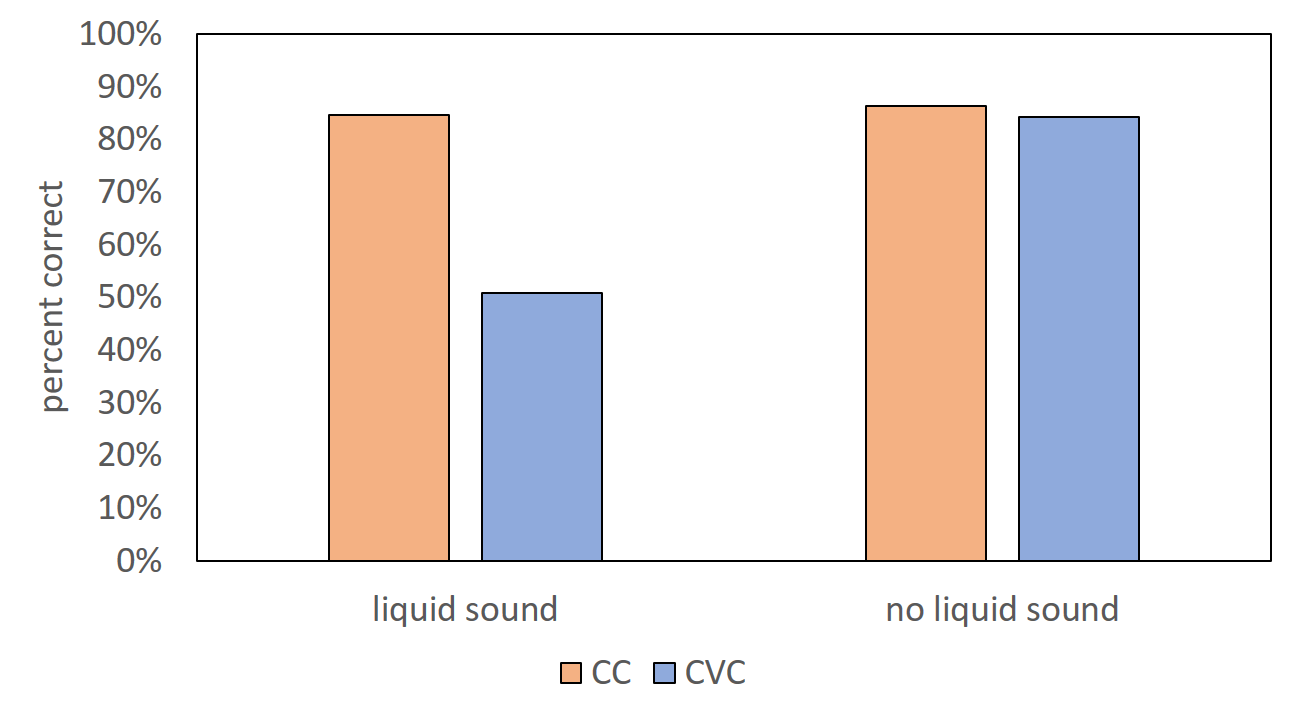
To find out why Japanese listeners’ performance was lower for CVC words than for CC words, we further analyzed the data based on phonetic properties of the target words. It turned out that Japanese listeners’ performance was especially poor when the target word contained a particular type of sound, namely, a liquid consonant such as “l” and “r”. Figure 2 shows Japanese listeners’ identification accuracy for target words that contained a liquid consonant (left half), like blow-below, prayed-parade, scalp-scallop, course-chorus, and for target words that did not contain a liquid consonant (right half), like ticked-ticket, camps-campus, sport-support, mint-minute.
The left half of Figure 2 shows that while Japanese listeners’ accuracy for CC words that contained a liquid consonant, like blow, prayed, was about 85%, their accuracy for the CVC counterparts, e.g. below, parade, was about 51%, which is at chance (guessing) level. In contrast, the right half of Figure 2 shows that Japanese listeners’ performance on words that did not contain a liquid sound was around 85%, with virtually no difference between CC and CVC words. Figure 2. Percent correct identification rate for word pairs that contained a liquid consonant, e.g. blow-below, prayed-parade (left half) and word pairs that did not contain a liquid consonant, e.g. ticked-ticket, camp-campus. Credit: Tajima/ Shattuck-Hufnagel
Why was Japanese listeners’ performance poor for words that contained a liquid consonant? One possible explanation is that liquid consonants are acoustically similar to vowel sounds. Compared to other kinds of consonants such as stops, fricatives, and nasals, liquid consonants generally have greater intensity, making them similar to vowels. Liquid consonants also generally have a clear formant structure similar to vowels, i.e. bands of salient energy stemming from resonant properties of the oral cavity.
Because of these similarities, liquid consonants are more confusable with vowels than are other consonant types, and this may have led some listeners to interpret words with vowel + liquid sequences such as below and parade as containing just a liquid consonant without a preceding vowel, thus leading them to misperceive the words as blow and prayed. Given that the first vowel in words such as below and parade is a weak, unstressed vowel, which is short and relatively low in intensity, such misperceptions would be all the more likely.
Another possible explanation for why Japanese listeners were poorer with CVC words than CC word may have to do with the listeners’ familiarity with the target words and their pronunciation. That is, listeners may have felt reluctant to select words which they were not familiar with or did not know how to pronounce. When the Japanese listeners were asked to rate their subjective familiarity with each of the English words used in this study using a 7-point scale, from 1 (not familiar at all) to 7 (very familiar), it turned out that their ratings were higher on average for CC words (4.8) than for CVC words (4.1).
Furthermore, identification accuracy showed a moderate positive correlation (r = 0.45) with familiarity rating, indicating that words that were more familiar to Japanese listeners tended to be more correctly identified. These results suggest that listeners’ performance in the identification task was partly affected by how familiar they were with the English words.
Put together, the present study suggests that Japanese learners of English indeed have difficulty correctly identifying spoken English words that are distinguished by the presence vs. absence of a vowel. From a theoretical standpoint, the results are intriguing because they are not in accord with predictions based on vowel epenthesis, and suggests that detailed properties of the target words affect the results in subtle ways. From a practical standpoint, the results suggest that it would be worthwhile to develop ways to improve learners’ skills in listening to these distinctions.
References
Tajima, K., Erickson, D., and Nagao, K. (2003). Production of syllable structure in a second language: Factors affecting vowel epenthesis in Japanese-accented English. In Burleson, D., Dillon, C., and Port, R. (eds.), Indiana University Working Papers in Linguistics 4, Speech Prosody and Timing: Dynamic Aspects of Speech. IULC Publications.
Tajima, K. (2004). Stimuus-related effects on the perception of syllables in second-language speech. Bulletin of the Faculty of Letters, vol. 49, Hosei University.
Dupoux, E., Kakehi, K., Hirose, Y., Pallier, C., and Mehler, J. (1999). Epenthetic vowels in Japanese: A perceptual illusion? Journal of Experimental Psychology: Human Perception and Performance, 25, 1568-1578.